Personal Wealth Management / Politics
Is My Political Party Best for Stocks?
Fisher Investments’ commentary and research on politics is nonpartisan, favoring no party or politician, as political bias blinds and can lead to investment mistakes. The purpose of this commentary is to analyze the election’s potential impact on markets and the economy.

Key Takeaways:
- Although investors often worry what presidential election outcomes might mean for their portfolios, historical average returns for stocks are nicely positive under both Democratic and Republican presidents.
- Why? Because presidents have limited control over the economy and government spending. They usually aren’t able to get as much done as people hope or fear.
- This leads to a phenomenon Fisher Investments terms the “perverse inverse.” When a Republican candidate wins, stocks tend to perform strongly during the election year and then cool in the inaugural year. When a Democrat wins stocks usually post below-average growth in the election year, followed by strong inaugural year returns.
During the 2020 US presidential election campaign, many voters felt anxious regardless of their political allegiances. It's only natural to want your candidates to win and to feel that much hangs in the balance. The 2020 election cycle may have seemed especially perilous as COVID-19 continued to spread amid an uneven economic recovery.
Fisher Investments is politically neutral and interested solely in the likely market impacts of different political outcomes. We believe political bias—such as a preference for one party or candidate over the other—can lead to costly investing mistakes.
But we do have some insight to offer when it comes to investors' election fears. In particular, the fear that the stock market will do terribly if your party loses. Many people believe that their political party is best for financial markets. A closer look, supported by historical data, shows this isn’t the case.
No One Party is Inherently Better for Stocks
Because of how each party typically appeals to its base, investors traditionally see Democrats as favoring increased regulation, higher taxes and other “anti-business” policies. In contrast, Republicans usually run on cutting taxes and reducing regulations, making them appear business-friendly. But in reality, neither party is inherently good nor bad for stocks.
Historical returns on average are nicely positive for both Democratic and Republican presidents. Since 1925, average annual returns under Democratic presidents have been 14.8%. Average annual returns under Republican presidents have been 9.5%.[i] What difference there is between these average returns appears largely due to economic and market factors outside individual presidents’ control. For example, Herbert Hoover helps pull down the Republican average with negative -30.8% annualized returns during his single 1929 – 1933 term. While Hoover certainly made some mistakes, he had the misfortune of being President for the first 3 years of the Great Depression.
Who is president often doesn’t impact the economy as much as many believe. Ultimately, America’s economy is dominated by the private sector, meaning the vast majority of economic activity is outside the direct control of politicians. In 2018, the government accounted for 12.4% of US gross domestic product. Meaning, in that same year, the private sector accounted for 87.6% of US gross domestic product. The president cannot magically bend the entire economy to their will. The economy is big and resilient, less subject to political wrangling and less responsive to Federal Reserve policy changes than most realize.
Exhibit 1: Private Sector and Government Share of US GDP as of 2018
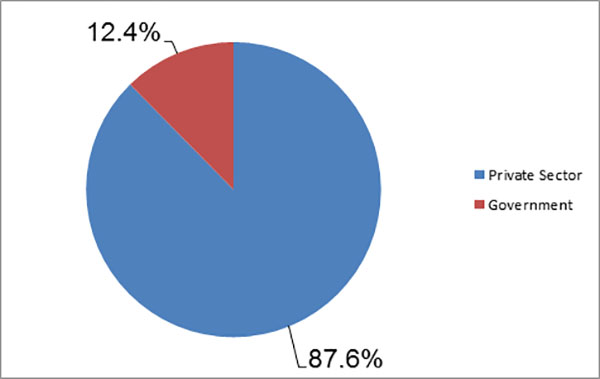
Source: FactSet, US Bureau of Economic Analysis, as of 1/14/2020.
Another important consideration is the partisan composition of Congress. The makeup of the House of Representatives and Senate can determine how much a president is actually able to accomplish. When you analyze returns based on which party held Congress, in addition to the presidency, the data become even less clear as to whether one party is better for stocks. No matter your political preference, allowing your view of one party or another to influence your investment decisions can be dangerous.
This isn’t to say political parties don’t matter to stocks—they do sometimes! But you need to objectively analyze how politics can influence markets. For example, presidential election and inaugural years tend to follow a pattern we’ve termed the “perverse inverse.”
The Perverse Inverse
Following the election, markets usually follow a trend we call the “Perverse Inverse.” When a Republican wins, stocks often perform above average in the election year, boosted by the GOP’s pro-business reputation. A Democratic victory often means muted market returns during the election year as folks fear a tough business environment. These are just common investor perceptions—we aren’t saying these reputations always match reality. But markets move on changes in relative expectations.
This phenomenon reverses the following year. When a Republican administration is inaugurated, elevated sentiment tees up high expectations—which often leave investors disappointed when the president inevitably begins to moderate or gridlock blocks big changes. A Democratic president also moderates upon entering the White House, but that reality usually exceeds investors’ dour expectations. Zoom out, however, and returns over this two-year stretch show no significant party favoritism. It is merely a matter of when the returns come.
Exhibit 2: Perverse Inverse
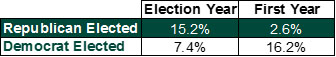
Source: Global Financial Data, Inc., as of 10/22/2018. S&P 500 total return in election and inaugural years, 1928 – 2017.
The Perverse Inverse is rooted in two core principles, one economic and one political. First, markets move on the difference between reality and expectations. Second, the legislative process tends to water down big campaign pledges.
Come back to our Election Hub regularly to stay up to date on how Fisher Investments views the current political environment and likely market impacts. Or call us at (800) 568-5082 to speak with a qualified representative who can provide further guidance on your personal situation.
[i] Global Financial Data as of 1/9/2020; S&P 500 Total Return Index from 12/31/1924 – 12/31/2019.

See Our Investment Guides
The world of investing can seem like a giant maze. Fisher Investments has developed several informational and educational guides tackling a variety of investing topics.
SHARE THIS MEDIA


Insights & Media


Learn More
Learn why 150,000 clients* trust us to manage their money and how we may be able to help you achieve your financial goals.
*As of 3/31/2024
New to Fisher? Call Us.
Contact Us Today