Personal Wealth Management / Market Analysis
A Retrospective on Those Spooky Halloween Chartbooks
Pundits dug deep for charts plotting their biggest fears, but in reality, they aren't very scary at all.


Smashing pundits' pumpkins. Photo by Marco Varro/iStockPhoto.
It is something of a Halloween tradition. Analysts in the spooky spirit pull together charts of things that allegedly go bump in the night, featuring them as things that should turn investors white with fear. This year, with the second-longest bull market in American history in its 93rd month, such collections were easy to come by. Bear stories! Rawr! The problem is the scariest charts pundits found just aren't very freaky at all.
The scary charts offered fall into three primary "fear" categories:
- Growth ghost stories of earnings recessions, wages rising from the dead and allegedly vanishing business investment
- Debt doom and gloom: Corporate, Chinese and negative interest rates
- Creepy central banks haunting everything
But when you unmask these fearful graphs, what you find is benign.
Growth Ghost Stories
Fear: S&P 500 Earnings have been declining, suggesting stocks lack fundamental support.
Unmasked!: Most earnings weakness in recent quarters was due to widely known troubles in the oil patch. Earnings ex-Energy are just off record highs and were down in only one quarter. Sure it'd be better if they were higher, but where they are now isn't too shabby. Even including Energy, earnings are starting to recover. Q3 2016's earnings season is about halfway through and expectations are for growth of 1.6%.[i] Q4 is expected to post 4.6%.[ii] Expectations for 2017 earnings growth, although subject to revision, currently average 12%.[iii]
Exhibit 1: Earnings Ex-Energy Are Fine
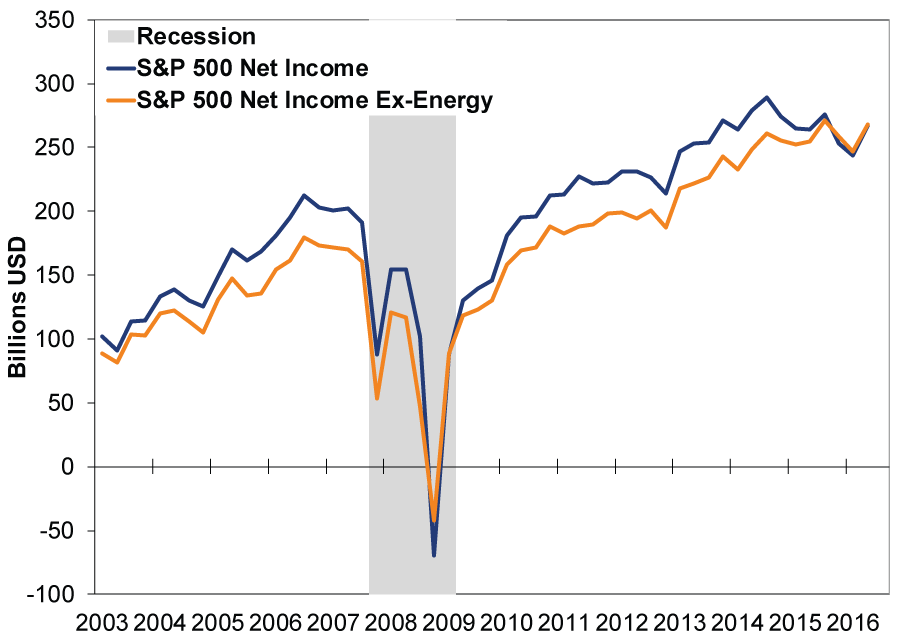
Source: FactSet, as of 10/31/2016.
Fear: Accelerating wage growth shrinks profit margins.
Unmasked!: Sometimes yes, sometimes no. There is no clear historical relationship between average hourly earnings growth and profit margins. In the current cycle, record low wage growth has roughly coincided with record high profit margins, so it isn't surprising profit margins have contracted somewhat over the past few years as wages have picked up a little. However, this has been far from a disaster for corporate profitability.
Exhibit 2: Profit Margins Still Look Good
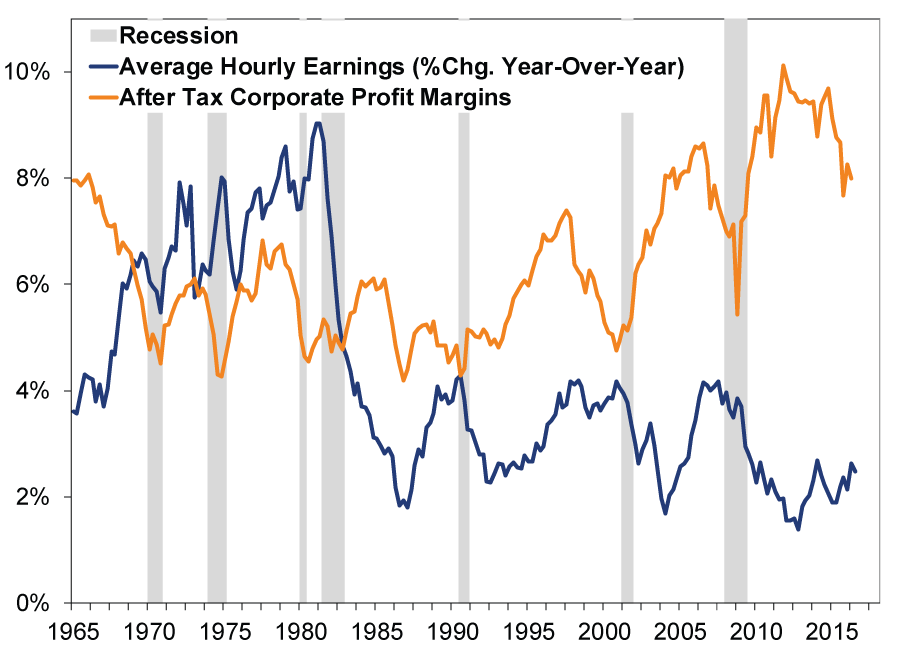
Source: St. Louis Federal Reserve, as of 10/31/2016. After-Tax Corporate Profit Margins calculated by dividing After Tax Corporate Profits with Inventory Valuation and Capital Consumption Adjustments with Final Sales of Domestic Product.
Corporations have other cost inputs besides labor. For example, cheaper energy and transportation costs allow firms to raise wages without blowing total costs sky high. Interest expenses, too, are presently super low. And while productivity has been notably slow during this expansion, it's been generally positive, the effects cumulative, and gradually adding to companies' bottom lines. Hence, while profit margins are off their recent highs, they're still well above their historical average. Declining margins also aren't an automatic impediment to rising stocks. Falling margins in the late-1960s and 1990s coincided with significant stock market gains.
Fear: Business investment is too low; faltering capital expenditures are evidence of a gloomy business outlook.
Unmasked!: Even including the Energy sector, capex looks ok. The US oil patch has had a brutal few years, and still likely faces significant headwinds, but Energy just isn't that large a part of the US economy or investment. The US faces no Dutch disease. As Exhibit 3 shows, Energy (orange) is only a small fraction of overall private nonresidential fixed investment (blue). The upshot is business investment ex-Energy (yellow) is at new highs, which contradicts the claim investment is too low. Maybe it's just not high enough for some people?
Exhibit 3: Private Investment? Still Pretty Good
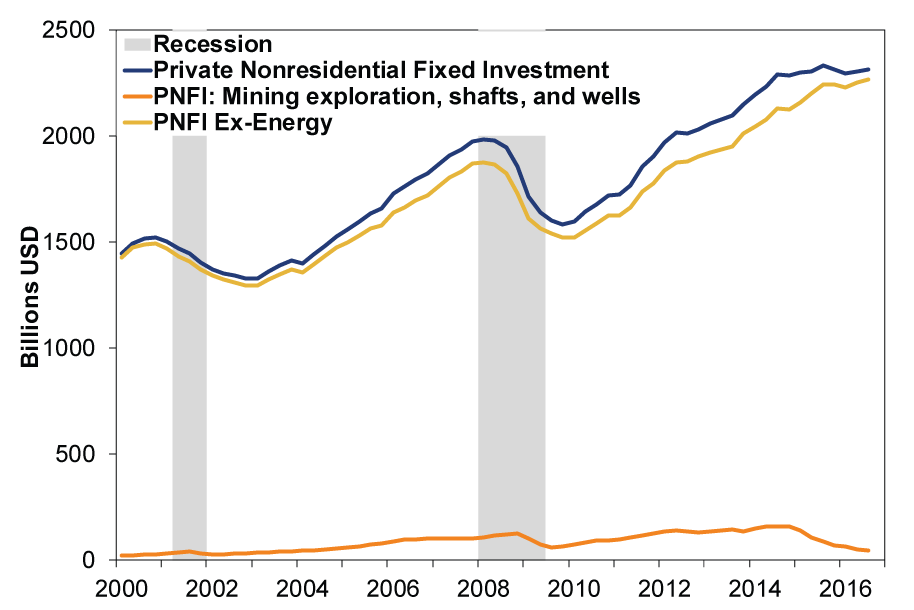
Source: St. Louis Federal Reserve, as of 10/31/2016.
As for the gloomy business outlook, some surveys, like the National Federation of Independent Business' Small Business Optimism Index, suggest business owners are dour. But this doesn't seem tied to cyclical conditions. Moreover, Exhibit 5 shows the forward-looking new orders components of both the ISM's manufacturing and non-manufacturing purchasing managers' indexes indicate growth. While these have been higher, they aren't "gloomy."
Exhibit 4: Small Business Owners Especially Skeptical...
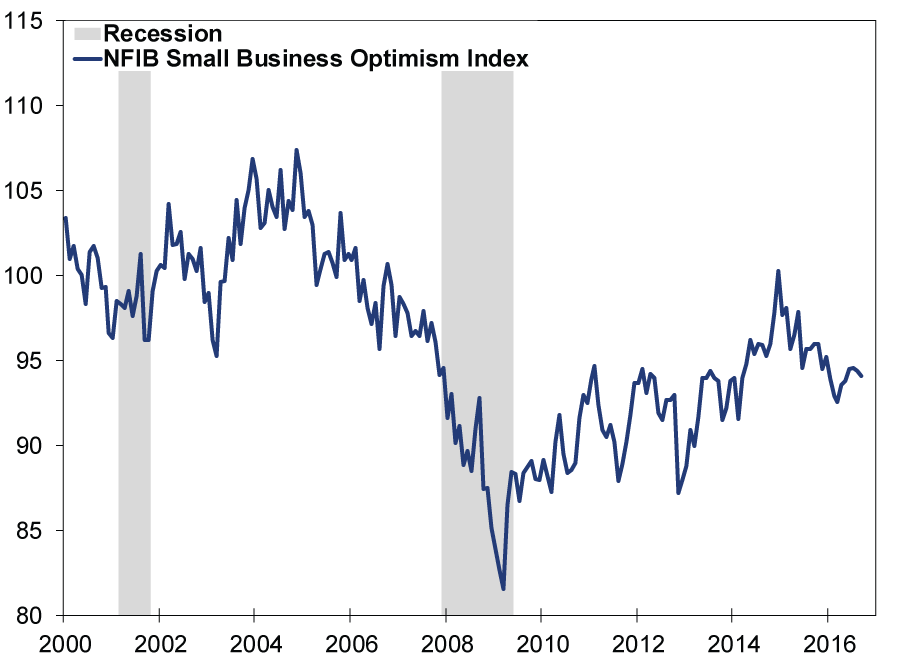
Source: FactSet, as of 11/02/2016. NFIB Small Business Optimism Index, 01/31/2000 to 09/30/2016.
Exhibit 5: ...But Most Businesses Report Growth in Orders
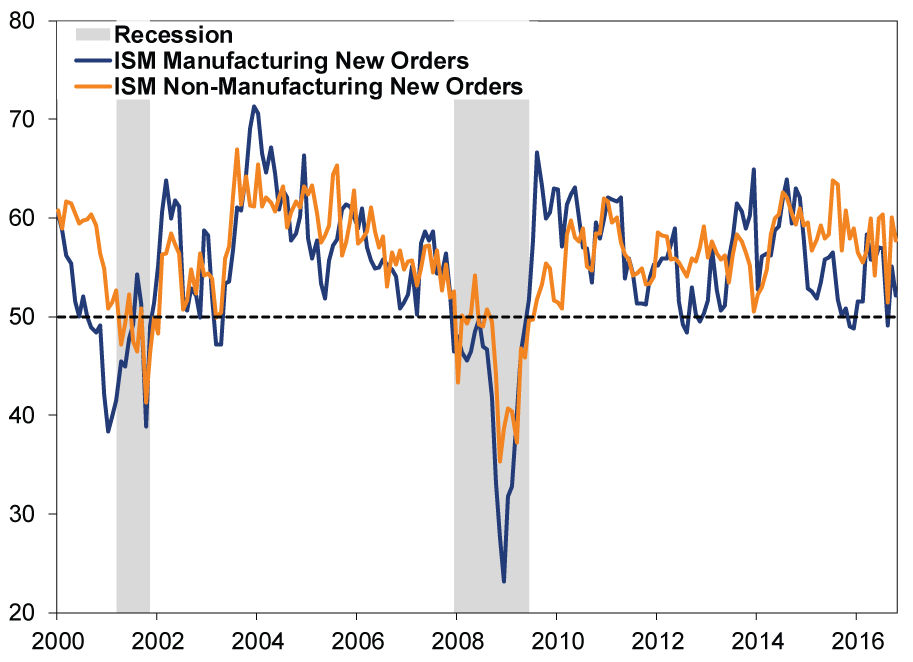
Source: FactSet, as of 11/03/2016. ISM Manufacturing and Non-Manufacturing New Orders Indexes, January 2000 - October 2016. Readings above 50 indicate more businesses saw growth than contraction.
It's possible that, as in this bull market's early days, small businesses fret credit availability. Many analysts feared a return to tight credit conditions after business lending dipped for seven weeks in Q3 and the yield curve flattened.[iv] But the fall was small and fleeting and, as Exhibit 6 shows, the yield curve has steepened by 44 basis points from its 2016 low on July 8.[v] While we'll not extrapolate a lending bonanza or fastflation™ just yet, this suggests the Q3 dip was a blip.
Exhibit 6: Yield Curve Starting to Get a Bit Steeper
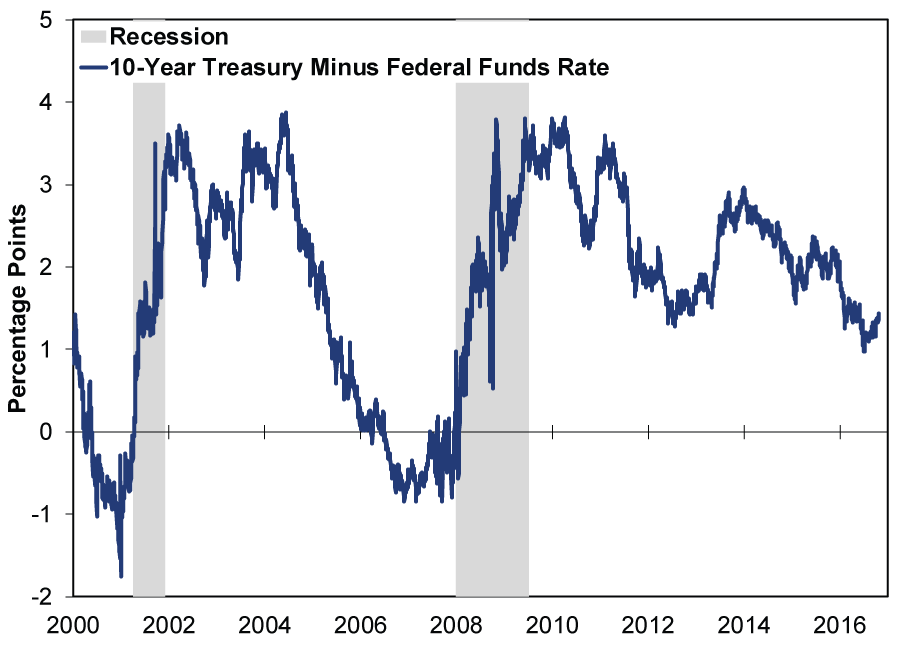
Source: St. Louis Federal Reserve, as of 10/31/2016.
Debt Ghouls
Fear: Corporate delinquencies and defaults are rising.
Unmasked!: While true, they're mostly coming from the Energy sector. Overall, interest coverage ex-Energy is fine. What does the bond market think of all this? It's been discounting the risk since 2014 (Exhibit 7). As oil plunged to decade lows at the start of the year, high-yield bond spreads-the difference between their yield and default-risk free Treasurys-widened considerably. With oil's rebound, spreads have come down again. That is how markets price in-and price out-default risk.
Exhibit 7: Credit Spreads Show Receding Default Risk Ahead
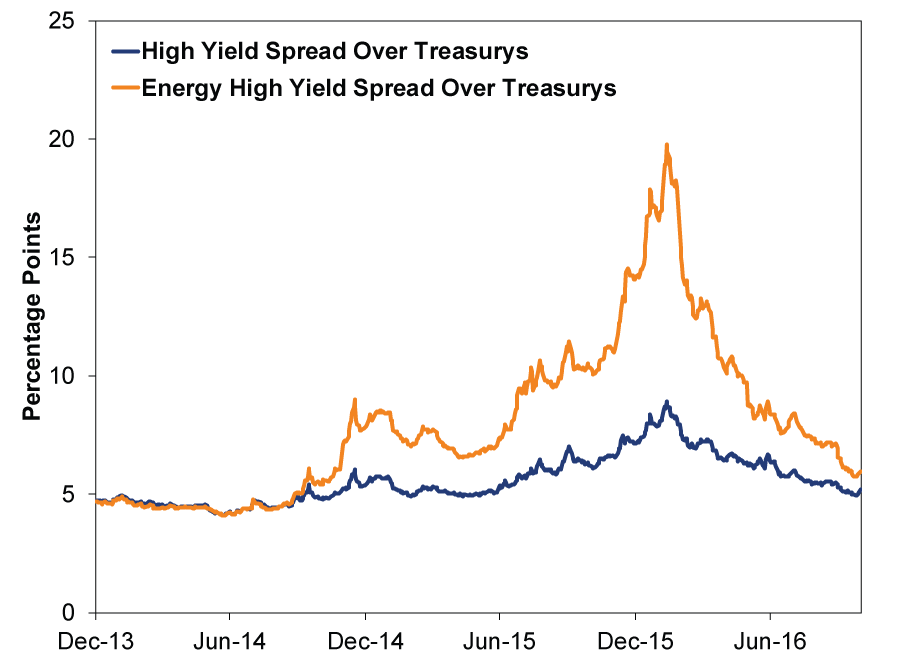
Source: FactSet, as of 10/31/2016. BofA Merrill Lynch US High Yield and US High Yield Energy spreads over the BofA Merrill Lynch US Treasury Index, 12/31/2013 - 10/31/2016.
Fear: Rising Chinese non-performing loans will lead to increased defaults.
Unmasked!: Maybe, if the government allows defaults. In a normal, non-communist, market economy, nonperforming loans would probably be higher than the officially cited 1.48%. We suspect, along with most analysts, Chinese banks are being granted regulatory forbearance in recognizing bad assets so they can be written off/disposed of with as little disruption as possible. While the lack of transparency is an issue in assessing this, few dispute China is willing and able to backstop banks and the economy. While total reserves are down $800 billion since its peak, China still has $3.2 trillion. Moreover, China's state-run banks carry an implicit guarantee from the state, which has recapitalized them on numerous occasions. Now then, if China does allow defaults, this could be a positive in the sense it would introduce more market forces into the economy.
Exhibit 8: China's Giant Pile of Cash Is Still Giant
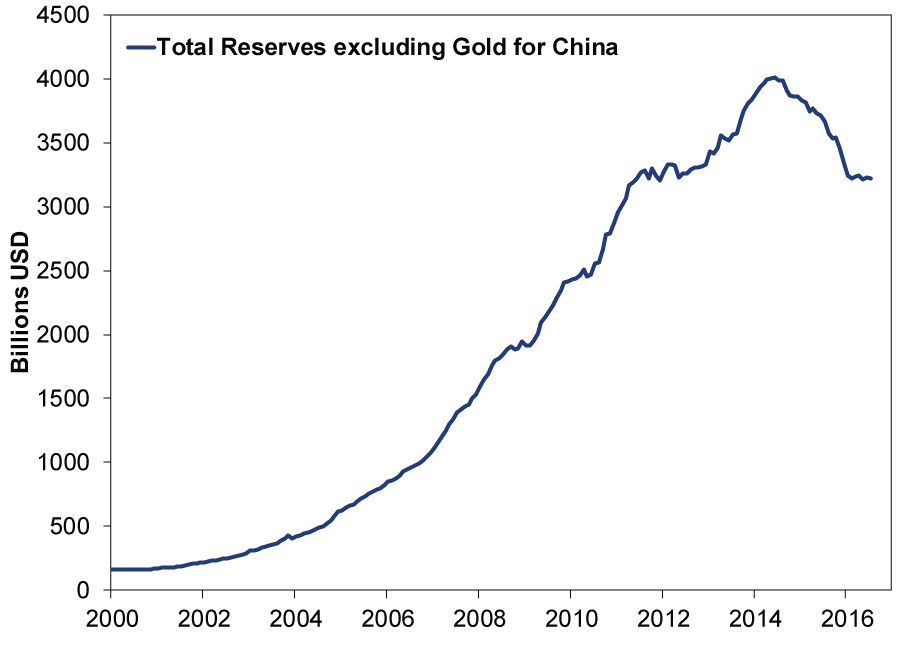
Source: St. Louis Federal Reserve, as of 10/31/2016.
Fear: Low/negative rates will lead to bad lending, misallocation of capital.
Unmasked!: This misperceives why low or negative rates have failed to ignite a lending spree.[vi] Low rates may boost demand. But they also flatten the yield curve-compressing net interest margins-which disincentivizes bankers to lend. The eurozone has seen loan growth trail the US consistently in recent years despite overall lower (even negative) rates. And the lending pickup in recent years started before the ECB went negative. Japanese loan growth is even worse. US credit growth is better with higher rates, and accelerated after quantitative easing ended. All of which to say that central bank policy is impeding lending more than spurring it to crazy heights. We guess it is possible low rates could someday spur credit misallocation, but that seems far off from here and won't be determined by the sheer level of rates alone.
Exhibit 9: US Credit Growth Despite, Not Because of, Low Rates
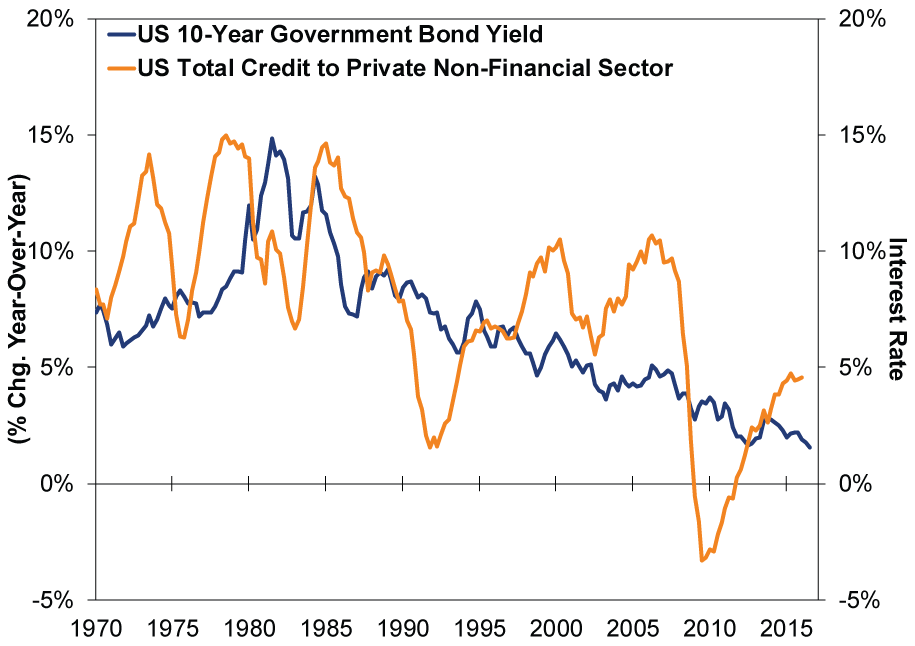
Source: St. Louis Federal Reserve, as of 10/31/2016.
Exhibit 10: Japan's Monetary Bazooka More Like a Kazoo
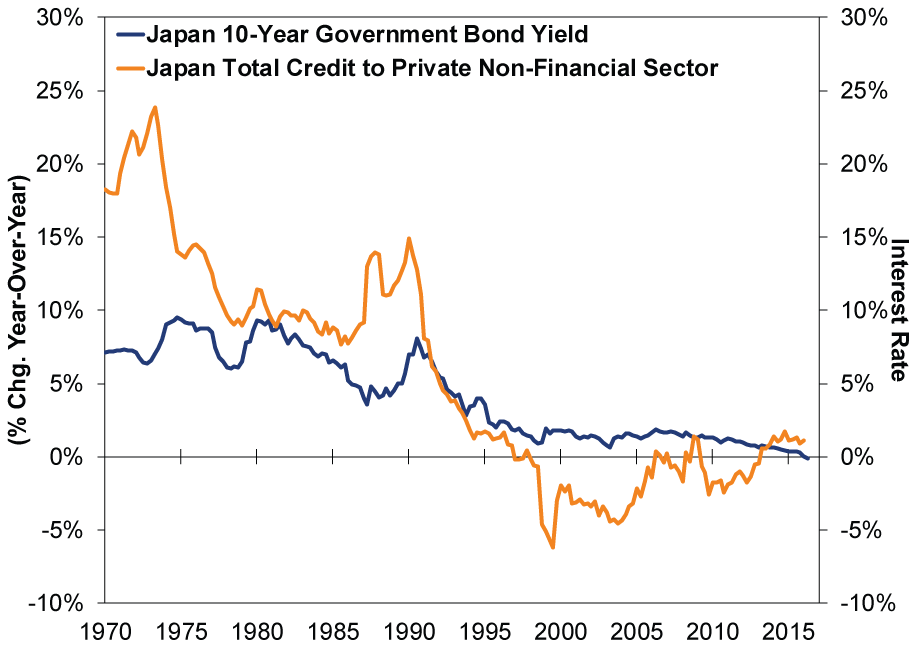
Source: St. Louis Federal Reserve, as of 10/31/2016.
Creepy Central Banks
Fear: Central bank monetary policies around the world have been ineffective, if not counterproductive, and amount to pushing on a string.
Unmasked!: Yup. But the economy has proven resilient to this for years, and we see little reason to think now is different. Economic conditions, per the above, aren't as scary as they're made out to be. This fear isn't so much a fear as it is a reason to celebrate the dynamic private sector ahead of Thanksgiving!
[i] Source: FactSet Earnings Insight, as of 10/28/2016.
[ii] Ibid.
[iii] Ibid.
[iv] The yield spread, the difference between short- and long-term interest rates, is a proxy for bank lending's profitability. Wider means more profitable and, hence, more plentiful generally.
[v] Source: FactSet, as of 11/3/2016. 10-Year US Treasury yield minus fed funds target rate, 12/31/2015 - 11/2/2016.
[vi] We could have told central bankers that, but they never asked us. Alas.
If you would like to contact the editors responsible for this article, please message MarketMinder directly.
*The content contained in this article represents only the opinions and viewpoints of the Fisher Investments editorial staff.
Get a weekly roundup of our market insights.
Sign up for our weekly e-mail newsletter.
See Our Investment Guides
The world of investing can seem like a giant maze. Fisher Investments has developed several informational and educational guides tackling a variety of investing topics.
SHARE THIS MEDIA


Related Resources


Learn More
Learn why 150,000 clients* trust us to manage their money and how we may be able to help you achieve your financial goals.
*As of 3/31/2024
New to Fisher? Call Us.
Contact Us Today