Personal Wealth Management / Market Analysis
Checking In on Oil Stocks
Record US oil production in sight likely weighs on Energy sector performance.

As 2017 closes, we look back to global stocks’ weakest sector this year: Energy. Global Energy stocks are up only 5.0% year to date, badly lagging the MSCI World Index’s 22.6% return.[i] What gives? Energy sector profits are tied to oil prices over time, and rising global supply likely weighs on prices and Energy stocks’ returns for the foreseeable future. While investors seem enthusiastic over higher oil prices this year, we see a few reasons why their optimism for Energy stocks is still premature.
Our tale begins in December 2016, when OPEC and other oil exporters voluntarily restricted their output in order to battle a supply glut that caused oil prices to fall by more than half since mid-2014. At the time, many expected it to put a floor under oil prices, and Brent and WTI crude oil are indeed up 20.8% and 11.0%, respectively, year to date.[ii] While Energy is the world’s worst performing sector for the full year (with one day to go), that is because it had a terrible first half. Energy stocks outperformed in the second half, making this a key question for 2018: Is the second half a countertrend or the start of a sustained recovery?
Those looking at the sector’s earnings growth rates and oil prices’ 2017 bounce lean toward the latter, since Energy earnings—which grew triple digits this year—depend on oil prices. But stocks look forward, not backward. If global supply rises, oil prices likely encounter further pressure, making 2017’s Energy earnings bounce short-lived. People don’t broadly seem to appreciate the earnings recovery stemmed from a low base effect. Once that is out of the math in 2018, absent a sustained rise in oil prices, we suspect it will be difficult for Energy firms to beat investors’ high expectations for the sector.
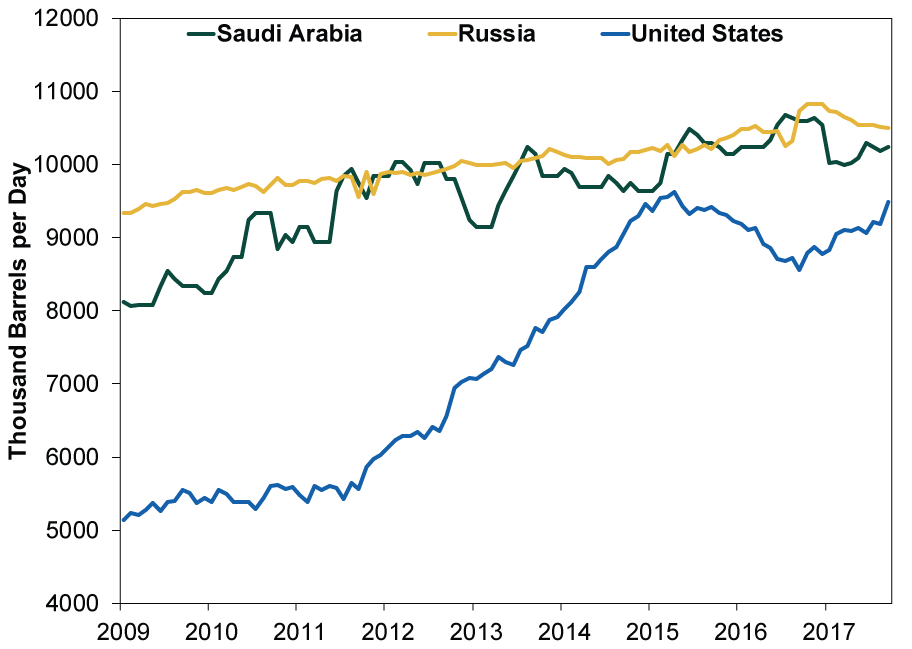
Based on our analysis of oil production, we think Energy’s strong second half is probably a countertrend, and not just because the US Energy Information Administration (EIA) forecasts record-high 2018 US oil production. Current weekly production is now 9.8 million bpd, closing in on Saudi Arabia (10.2m bpd) and Russia (10.5m bpd).[iii] (Exhibit 1) US production surged in 2017, and the factors driving that surge remain in place.
Exhibit 1: US Challenges Top Oil Producers
Source: US Energy Information Administration, as of 12/26/2017. January 2009 – September 2017.
While some suspect the US could cut output in order to support prices, this ignores some key differences between America and most of the world’s oil giants. Unlike most OPEC nations (and non-OPEC Brazil and Norway), America’s oil industry isn’t state-run. It is a private-sector beast. Top-down production quotas are powerless here. Production decisions happen at the company level and are entirely market-driven. Currently, the market doesn’t provide much urgency to cut back. US shale drilling technology continues to improve, raising profitability per well drilled. While US drillers’ shareholders might welcome a production pullback—and less efficient operators exiting the business—industry incentives still aren’t aligned. Creditors need to be paid—ahead of shareholders’ interests—which argues against debt-laden US suppliers cutting back. With breakeven prices lower than they were when US producers slashed investment in 2015 and early 2016, more cutbacks seem unlikely. Rather, firms have renewed incentives to pump away and recoup those investments.
Shale drillers also have the financial wherewithal to do so. Many have already locked in late 2017’s somewhat higher prices for next year using futures contracts. This doesn’t guarantee delivery, but they improve the chances of profitable drilling. While the EIA forecasts US production to average 10.0 million bpd next year, some traders estimate output as high as 10.6 million. Forecasts vary and are just opinions—not blueprints or crystal balls—but even conservative projections show the US challenging OPEC’s dominance.
While US output has risen over the past 14 months, global output is down since November 2016—due in large part to that agreement between OPEC, Russia and a few others. They announced 1.8 million bpd in cuts last year, but off a 53.5 million bpd monthly record, which they ramped up to ahead of the announcement. Since then, they have fallen short of their goal. Collective production averaged 52.2 million bpd so far in 2017, missing their target by half a million barrels. While they have taken about 1.3 million bpd off the market, rising US output offset a big chunk of it.
Oil prices hinge on a few factors: Will US production keep rising? Will producers in other non-OPEC nations like Canada, Norway, Brazil and the UK be incentivized to raise production? Will OPEC, Russia et al extend their cuts? Or will factors like Russia’s desire to ramp up production and boost state revenues ahead of next year’s “election” win out? Then there is the matter of market share, which US producers stole this year. As the US gathers a greater piece of the production pie, it places more pressure on countries that self-imposed supply cuts to relent. We aren’t in the business of forecasting commodity markets, but the incentives seemingly favor higher production looking forward.
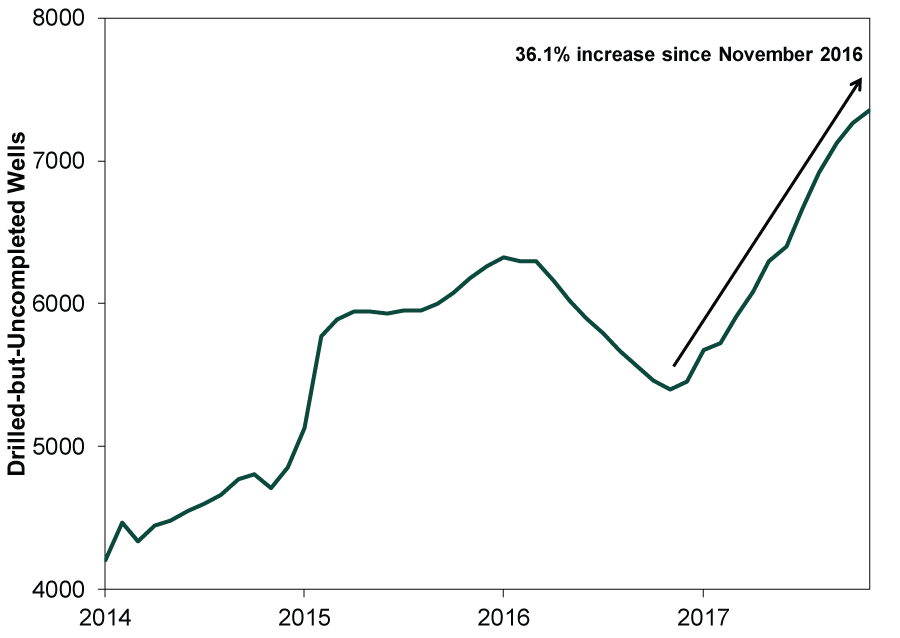
So do structural factors, like the US’s infamous “fracklog” of drilled-but-uncompleted (DUC) wells. There is a 36.1% increase in DUCs since OPEC & friends first announced their production cuts. These wells are likely ready to produce and waiting to be tapped with an uptick in prices. The hard work and fixed costs for these have largely been sunk—the spigot just needs a bit more turning for latent supply to flow.
Exhibit 2: More Where That Came From
Source: US Energy Information Administration, as of 12/26/2017.
One day, the Energy cycle will turn. But probably not as soon as people expect. Commodity cycles are long and slow because new projects can have lengthy lead times—often years in the making—and the cutback process is similarly slow due to all the sunk costs. As long as investors fail to appreciate this, instead expecting every latest development to have some huge impact on prices, Energy’s day in the sun probably remains further out than people think.
[i] Source: FactSet, as of 12/28/2017. MSCI World Energy and MSCI World Index returns with net dividends, 12/30/2016 – 12/28/2017.
[ii] Ibid. WTI Crude Oil, 12/31/2016 – 12/28/2017.
[iii] Source: US Energy Information Administration, as of 12/28/2017.
If you would like to contact the editors responsible for this article, please message MarketMinder directly.
*The content contained in this article represents only the opinions and viewpoints of the Fisher Investments editorial staff.
Get a weekly roundup of our market insights.
Sign up for our weekly e-mail newsletter.

See Our Investment Guides
The world of investing can seem like a giant maze. Fisher Investments has developed several informational and educational guides tackling a variety of investing topics.
SHARE THIS MEDIA


Related Resources


Learn More
Learn why 150,000 clients* trust us to manage their money and how we may be able to help you achieve your financial goals.
*As of 3/31/2024
New to Fisher? Call Us.
Contact Us Today