Personal Wealth Management / Market Analysis
Illusions of Bond ETF Illiquidity
Longstanding fears surrounding high-yield bond ETF liquidity are detached from the data.

Over the past year bond market liquidity—the ability to quickly redeem an asset for cash without moving the price much—has gone from an obscure, seldom-mentioned topic to one of the financial press's favorite fears. Worries centered on high-yield exchange-traded funds (ETFs), with pundits and prominent investors frequently warning they operate on the illusion of liquidity. We've addressed this issue several times on MarketMinder (here, here and here). I won't rehash those points in full, but for a quick refresher, regulatory changes made bond dealers less willing to hold large inventories and act as intermediaries. This, pundits theorize, makes bonds less liquid. Compounding the issue is the increased use of ETFs that promise equity-like liquidity but are backed by much less liquid bonds. This "mismatch" is the alleged liquidity illusion, and many claim a high-yield selloff and the accompanying high volumes will reveal a rough reality: that investors can't redeem quickly without accepting dramatically lower prices. Yet despite a deep correction and record volumes in high-yield ETFs in 2015, we've seen no signs of liquidity issues. High-yield ETFs' liquidity isn't an illusion. These fears miss ETFs' ability to create very real liquidity of their own.
To better understand why these liquidity concerns are false, let's first consider bond ETFs' size relative to their underlying benchmarks. High-yield ETFs are a fairly new investment tool—the first launched in 2007. Since then, they have gained popularity and, as of November, had over $42 billion in assets.[i] Yet despite the rise in high-yield ETF assets, they represent only a small portion of the US dollar-denominated high-yield market. In other words, these ETFs are too small to dictate what happens to the overall index—it's the other way around.
Exhibit 1: Total Value of High-Yield ETF Assets as a Percentage of High-Yield Index Market Value
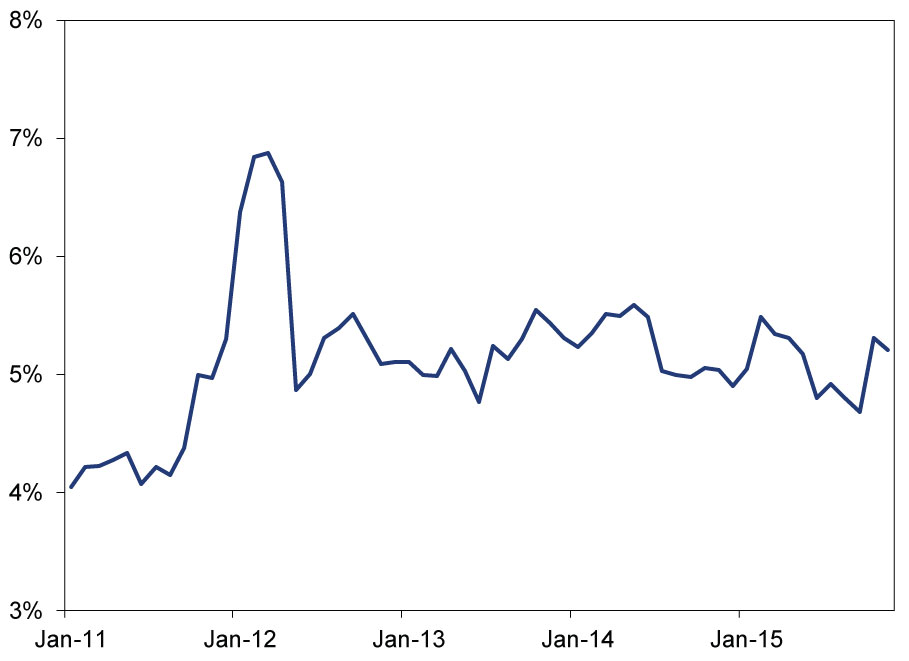
Source: Factset, Investment Company Institute (ICI), as of 1/26/2016. ETF value measured by ICI as of 11/30/2015. Index values are the iBoxx USD Liquid High-Yield Index market value.
Investors using high-yield index ETFs to gain exposure to the broader high-yield market expect them to mirror the index in question and accurately represent the underlying bond values. Hence, long-lasting dislocations between how high-yield ETFs and the underlying index perform (tracking error, in professional lingo), especially during times of distress, could signal liquidity issues. Likewise, if ETF share prices diverge widely from the value of the underlying bonds (called the ETF's net-asset value or NAV), this could also indicate liquidity-driven inefficiency in the ETFs.
According to critics' warnings, all it would take is a period of heavy selling in high-yield markets for these liquidity problems to come to light. Yet data show those opinions lack factual support. Exhibit 2 shows December's massive trading volumes for HYG, the largest high-yield ETF available. Volumes didn't simply beat the previous record amounts seen in April 2015—they more than doubled it. Trading was eight times higher than the past five years' average. If there was ever a time for problems to show up in high-yield ETFs, this likely would have been it.
Exhibit 2: HYG 10-Day Average Trading Volume
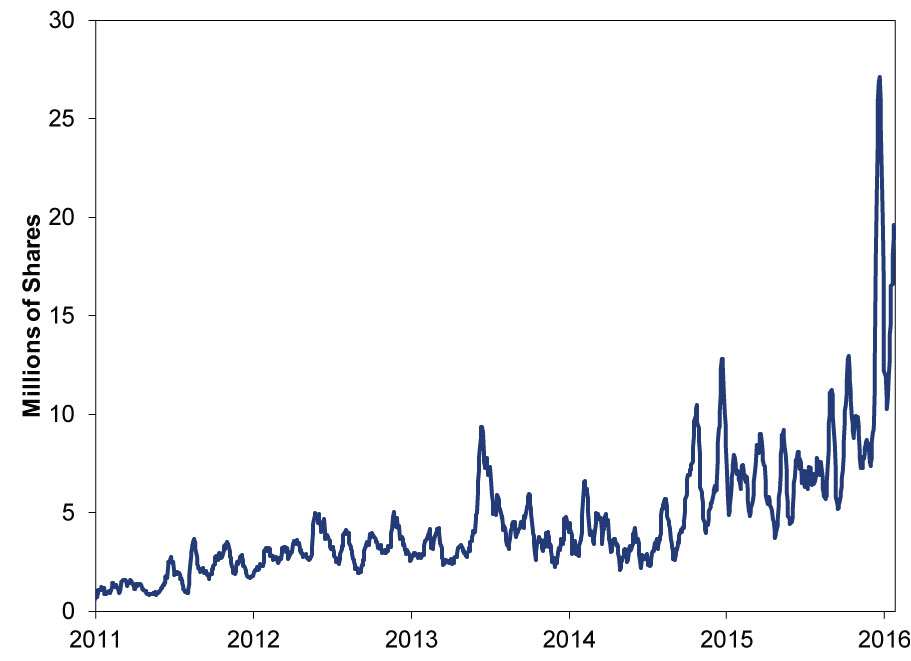
Source: FactSet, as of 1/28/2016.
Yet during this period of skyrocketing volume, tracking error didn't spike. Similarly, ETF market prices didn't wildly diverge from their NAVs. These two tell-tale signs of liquidity issues signaled no problems.
Exhibit 3 addresses tracking error, showing the 10-day and 20-day moving average spreads between HYG and its benchmark. Positive values indicate HYG is outperforming the index and negative values show underperformance. A poorly constructed ETF or one that had issues managing its liquidity would show large, persistent tracking errors (positive or negative). But that didn't happen. During December's huge volume, the spread between HYG's performance and the high-yield index was only 0.13%—hardly worth fretting. And even this is over an extremely short timeframe—days, not the years or decades constituting most investors' time horizon.
Exhibit 3: HYG Percentage Return Minus iBoxx USD Liquid High Yield Index Percentage Return
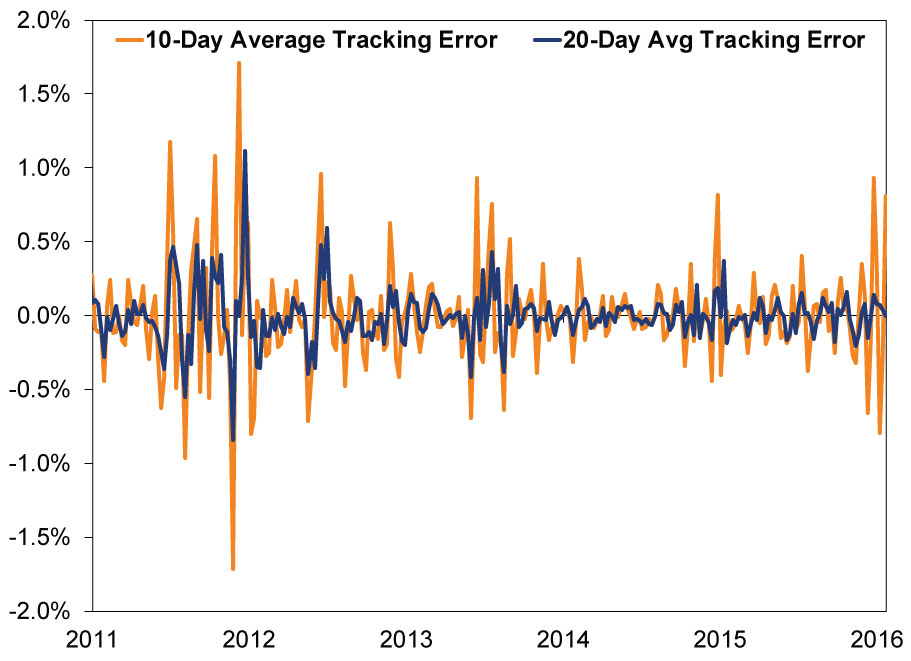
Source: FactSet, as of 1/28/2016.
Exhibit 4 shows there also hasn't been a sizable dislocation between HYG's share price and its NAV. Historically, HYG usually trades at a small premium to its NAV, and even in periods of relatively high net outflows it's rare for prices to fall below NAV for more than a few days.
Exhibit 4: HYG Market Price Premium, Percentage Over NAV
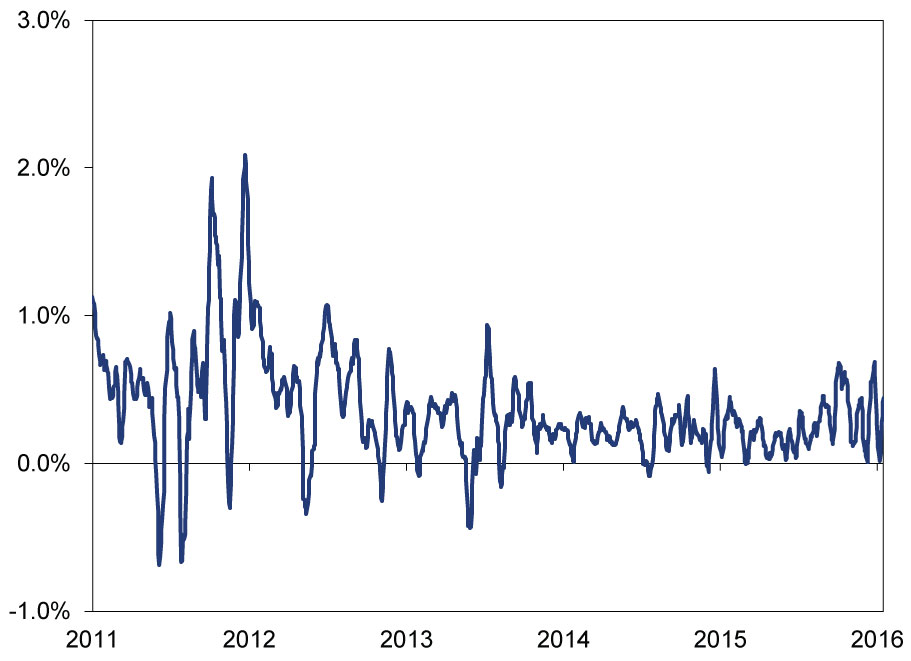
Source: Bloomberg, as of 1/28/2016.
Why didn't the high-yield selloff and big December volumes put HYG under liquidity stress? Well, it turns there's one key part about ETFs liquidity-fretting pundits overlook: Bond ETFs actually add liquidity. No, bond ETFs don't increase the underlying bonds' liquidity, but most ETF trading doesn't actually touch the underlying bonds. Typically, ETF shares change hands many times over without a single share of the ETF being created or redeemed. Only creation or redemption triggers bond trading, as the ETF-a basket of bonds-would then have to be constructed or deconstructed. ETF trading means simply shifting the entire basket-composition unchanged—from one owner to another.
Case in point: When news broke on December 10 about Third Avenue's distressed-debt fund halting redemptions and liquidating its holdings, HYG had net outflows of nearly $956 million over the next two days. But trading volume over those two days was over $7.3 billion! $7.70 worth of ETF shares traded hands for every dollar of underlying bonds redeemed. In times of lower volatility, HYG often goes days without any shares being created or redeemed, as it did in 13 of the 16 trading days immediately preceding Third Avenue's announcement. This is the dynamic "liquidity illusion" theories miss.
At this point, given the scope of selling in high-yield markets, widening credit spreads and the first rate hike by the Fed, it seems most of the things folks feared would reveal the liquidity illusion happened, and yet the fears didn't materialize. Perhaps that's because fears over high-yield ETF liquidity were misplaced from the get go.
[i] FactSet, ICI, as of 1/26/2016. High-yield bond ETF total net assets in millions of US dollars, 11/30/2015.
If you would like to contact the editors responsible for this article, please message MarketMinder directly.
*The content contained in this article represents only the opinions and viewpoints of the Fisher Investments editorial staff.
Get a weekly roundup of our market insights.
Sign up for our weekly e-mail newsletter.

See Our Investment Guides
The world of investing can seem like a giant maze. Fisher Investments has developed several informational and educational guides tackling a variety of investing topics.
SHARE THIS MEDIA


Related Resources


Learn More
Learn why 150,000 clients* trust us to manage their money and how we may be able to help you achieve your financial goals.
*As of 3/31/2024
New to Fisher? Call Us.
Contact Us Today