Personal Wealth Management / Market Analysis
The State of Real Estate
Why housing probably won’t collapse—or soar a whole lot more.

As you may be aware, the nation’s home prices rose quite a bit last year. The latest data show the S&P National Home Price Index rose 18.8% y/y in November (after it touched 20.0% in August), outstripping 2005’s peak annual gain.[i] Beyond prices, anecdotes about seeming insanity in the housing market abound, from writing love letters to land a deal to bids going far over list price and homes sitting on the market for mere hours. To many, the gains plus these tales make it seem as if a housing bubble is surely inflating, ready to pop—a throwback to what some see as the cause of the 2007 – 2009 financial crisis. But in our view, the drivers behind today’s housing market look quite different from 2005 – 2006’s frenzy—and it is critical to recall the housing bubble itself didn’t drive 2008’s downturn anyway.
Today’s spiking prices stem from extremely limited supply and steady, if not elevated, demand as the pandemic and remote working spur people with the means to do so to upgrade, move to the suburbs or relocate to a new state—or all three. At fewer than a million units in December, inventories are at their lowest in at least a couple decades. (Exhibit 1) Now, this series isn’t seasonally adjusted—hence the regularly recurring jagged pattern in the line. Inventories normally dip in December and January. But looking at the year-over-year percentage change eliminates this skew, and inventories were still down -14.2% y/y in December.
Exhibit 1: Far Fewer Homes for Sale Now Than in 2006
Source: FactSet, as of 1/27/2022. National Association of Realtors inventory of existing homes for sale, January 1999 – December 2021.
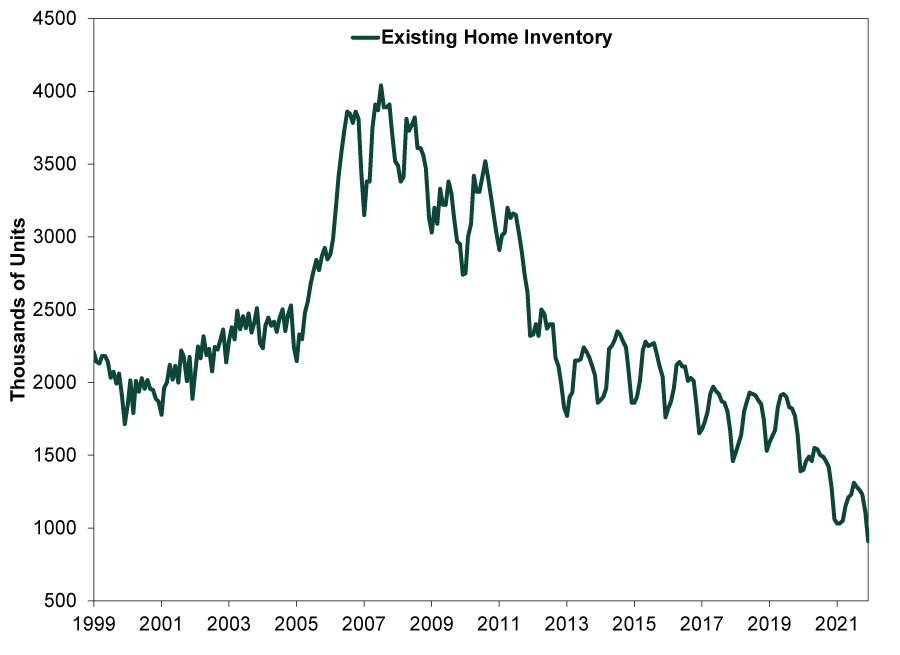
Lack of available homes for sale supports pricing, and it is no secret how we got here: Lockdowns halted construction, then resource shortages delayed efforts to reboot it. Hot markets where supply can normally grow easily to meet demand, like the greater Houston area, suddenly had an influx of new buyers bidding for a finite supply of existing homes. Construction couldn’t respond quickly enough. Contrast this with 2005 – 2006. Housing inventory rose from just over two million starting in 2005 to almost four million near 2006’s end.
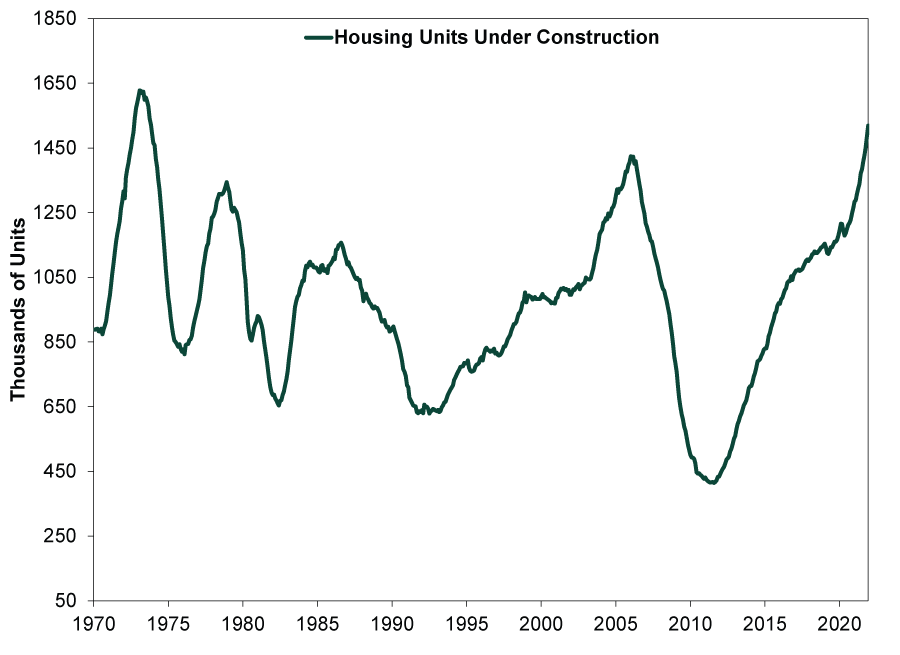
But now construction appears poised to catch up. Homes under construction are at their highest level in almost 50 years. (Exhibit 2) Part of this is a catchup effect. But also, new building permits for privately owned housing hit their highest point since May 2006 in December.[ii] For full-year 2021, the Census Bureau noted 1.7 million units were permitted. No shock, then, that builders started construction on 1.6 million new housing units last year.
Exhibit 2: Building Boom
Source: Federal Reserve Bank of St. Louis, as of 1/27/2022. Total new privately owned housing units under construction, January 1970 – December 2021.
Now, new homes aren’t exactly rolling off assembly lines—as widely reported, it hasn’t always been a smooth process getting materials (and labor) to build a house lately. On average, it is taking more than half a year from start to completion for single-family homes and over a year for multi-unit dwellings.[iii] However, prices are a powerful incentive, suggesting supply will rise, even if slower than normal. Builders will, eventually, finish new homes. Hard to imagine, we know, but housing may not be as supply constrained over the next year or so outside the handful of places with long-running shortages stemming from development roadblocks, like the San Francisco Bay Area.
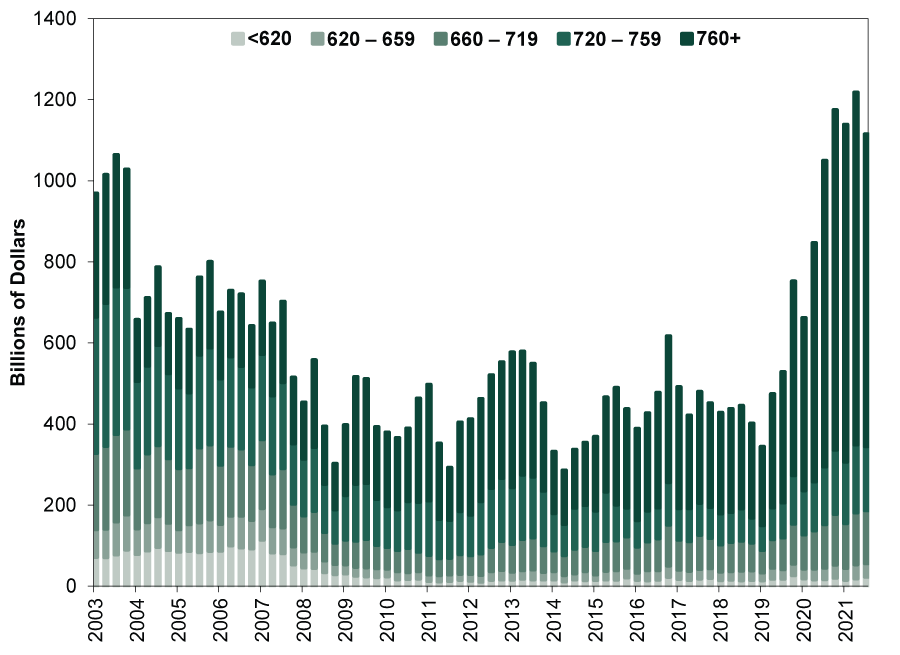
There are other big differences between the early/mid-2000s’ housing mania and the current situation. For one, back then it was easier to qualify for a mortgage. Underwriting standards are much higher now. (Exhibit 3) Credit scores aren’t perfect, but to the degree they broadly reflect borrowers’ ability to service debt, the vast majority of mortgages taken out the last couple years are from creditworthy buyers.
Exhibit 3: Mortgage Originations by Credit Score
Source: Federal Reserve Bank of New York, as of 1/27/2022. Mortgage originations by credit score, Q1 2003 – Q3 2021.
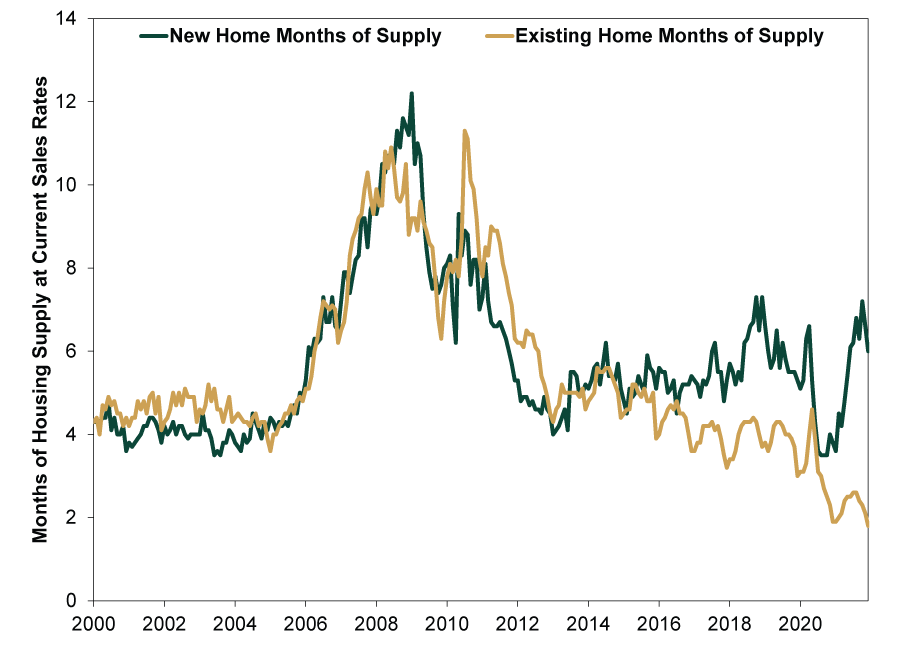
Then, too, the “field of dreams” build it and they will come mentality is absent. In the early 2000s, home prices’ climb wasn’t irrational. But after a few years of high-single-digit appreciation nationally, froth took over America’s housing market. By 2006, construction activity vastly outstripped demand. New home months of supply—current inventory divided by the going monthly sales rate—was high and rising. (Exhibit 4) Today, it is at six months of supply, right on the historical average since 1963. It has been falling, too. Note, also, existing home supply is sitting at a record low 1.8 months. New and existing homes aren’t exact substitutes, but they are close. It seems to us new housing construction is attempting to make up for the dearth in existing home inventory. Residential building hasn’t reached the speculative phase. It is still in catchup mode.
Exhibit 4: Housing Inventory Roughly in Balance With Monthly Sales Rates
Source: Federal Reserve Bank of St. Louis and FactSet, as of 1/27/2022. New and existing home months of supply, January 2000 – December 2021.
Beyond the supply, demand and funding aspects of housing looking different from the mid-2000s, there is another reason not to fret a housing bubble tanking the economy and stocks. Housing’s downturn alone didn’t cause the 2007 – 2009 financial crisis and recession. It was FAS 157, the unintended consequences of the mark-to-market accounting rule’s application to illiquid assets. It forced banks to value illiquid, rarely traded assets they intended to hold to maturity based on the most recent trade in “similar” securities hedge funds were dumping. In 2008, this compelled banks to account for paper losses as if they were actual losses, making them raise capital. When interbank funding markets seized up, illiquid institutions went under even if they were still technically solvent.
The government’s response didn’t help, either. Haphazard measures like bailing out Bear Stearns while forcing nearly identical Lehman Brothers to fail six months later fueled more panic, as markets couldn’t handicap which institutions the feds would choose to live and die. At the end of the day, the supposedly “toxic assets” people blamed for bank failures mostly paid out—and the government eventually profited handsomely on the portfolio of distressed assets the Fed assumed from Bear Stearns and AIG as well as the preferred equity stakes it bought in many banks and the Treasury’s continued receivership over Fannie Mae and Freddie Mac.
Government actions aren’t predictable, so we wouldn’t say this time is different. What is different is that regulators revamped FAS 157 in 2011 (and revised it again in 2018). Banks can now place assets that don’t trade regularly into a separate bucket, giving them more leeway. (Also, nonbank lenders are issuing most mortgages nowadays—not banks.[iv]) All this to say, the surprise institutional vulnerabilities that transformed $300 billion in actual loan losses into an unnecessary and wildly exaggerated systemic-crisis-inducing $2 trillion capital shortfall don’t seem present today.[v]
Now, while we don’t think housing is presently a bubble about to burst, neither do we see a great case for real estate investing. Broad price gains like last year’s aren’t likely to last forever. Pandemic-era migration appears to be causing a demand surge, but we doubt elevated relocation will stick around after people settle down. Major supply chain kinks are already working out—lumber prices are down -40% from their May peak, for example—and are now mostly looking like one-time disruptions.[vi]
Beyond this, it is also tough to invest in national “average” home prices. Every market is different. Location, location, location, as they say. Owning properties across the country isn’t practical for most. Real estate can be hard to diversify and is very illiquid, even in a hot market. (“Crowdfunding” companies cropping up advertise they make it easy, but we suggest reading the fine print before you sign on.) Then there is the maintenance and upkeep, which can add up and often go unaccounted for in calculations of returns. If that is your cup of tea, have at it! Our view is simply that investors have better, more liquid options readily available that are easier to access and value.
[i] Source: FactSet, as of 1/27/2022. S&P CoreLogic Case-Shiller US National Home Price Index, August 2021 – November 2021.
[ii] Source: Census Bureau, 1/19/2022. Monthly new residential construction, December 2021.
[iii] “Most Housing Units Under Construction Since 1974,” Bill McBride, Calculated Risk, 11/17/2021.
[iv] “Nonbank Lenders Are Dominating the Mortgage Market,” Orla McCaffrey, The Wall Street Journal, 6/22/2021.
[v] We are always scouring to uncover any, though, of course.
[vi] Source: FactSet, as of 1/27/2022. Lumber price per board foot, 5/7/2021 – 1/27/2022.
If you would like to contact the editors responsible for this article, please message MarketMinder directly.
*The content contained in this article represents only the opinions and viewpoints of the Fisher Investments editorial staff.
Get a weekly roundup of our market insights.
Sign up for our weekly e-mail newsletter.

See Our Investment Guides
The world of investing can seem like a giant maze. Fisher Investments has developed several informational and educational guides tackling a variety of investing topics.
SHARE THIS MEDIA


Related Resources


Learn More
Learn why 150,000 clients* trust us to manage their money and how we may be able to help you achieve your financial goals.
*As of 3/31/2024
New to Fisher? Call Us.
Contact Us Today