


Are you ready to start your journey to a better financial future?
Personal Wealth Management / Market Analysis
Global Yield Curve Steepening Supports Growth
The yield curve is a leading credit indicator.

The UK joined this year’s global rate hike party by raising its Bank Rate a quarter point last week.[i] Australia also hiked—the fifth this year.[ii] These moves add to others in Europe, Japan and North America, leading many commentators we follow to warn of worsening credit conditions.[iii] We see these hikes as mistakes outside Japan. But we think the global yield curve (issuers’ borrowing costs plotted from short to long maturities) remains steep enough to support lending anyway—a key consideration when weighing monetary policy moves.
We don’t think monetary policy institutions’ rate hikes are automatically bad for global stocks or the economy. Our research finds they don’t reflect tighter financial conditions on their own. To us, the yield curve does, especially sovereign yield curves, which serve as reference rates for loans of many types. Our analysis shows banks borrow short term to fund longer-term loans, so when long rates (think: 10-year yields) globally top short (overnight or 3-month), banks’ new loans are typically profitable. The steeper the yield curve, we observe, the more money they make lending, incentivising loan growth—and looser credit. However, if short rates top long, inverting the yield curve—say, from monetary policy institutions’ excessive hiking—we find credit could contract as banks’ funding costs near or exceed potential new loans’ revenues.
Positively, as Exhibit 1 shows, the global yield curve is still steep. Despite monetary policy institutions’ alleged tightening, long rates globally remain higher than short. Moreover, the developed world’s GDP-weighted yield curve isn’t only positively sloped, but getting steeper—financial conditions are becoming more accommodative, in our view. We think this is an unheralded silver lining to this year’s bond market volatility.
Exhibit 1: Global Yield Curves Steepening
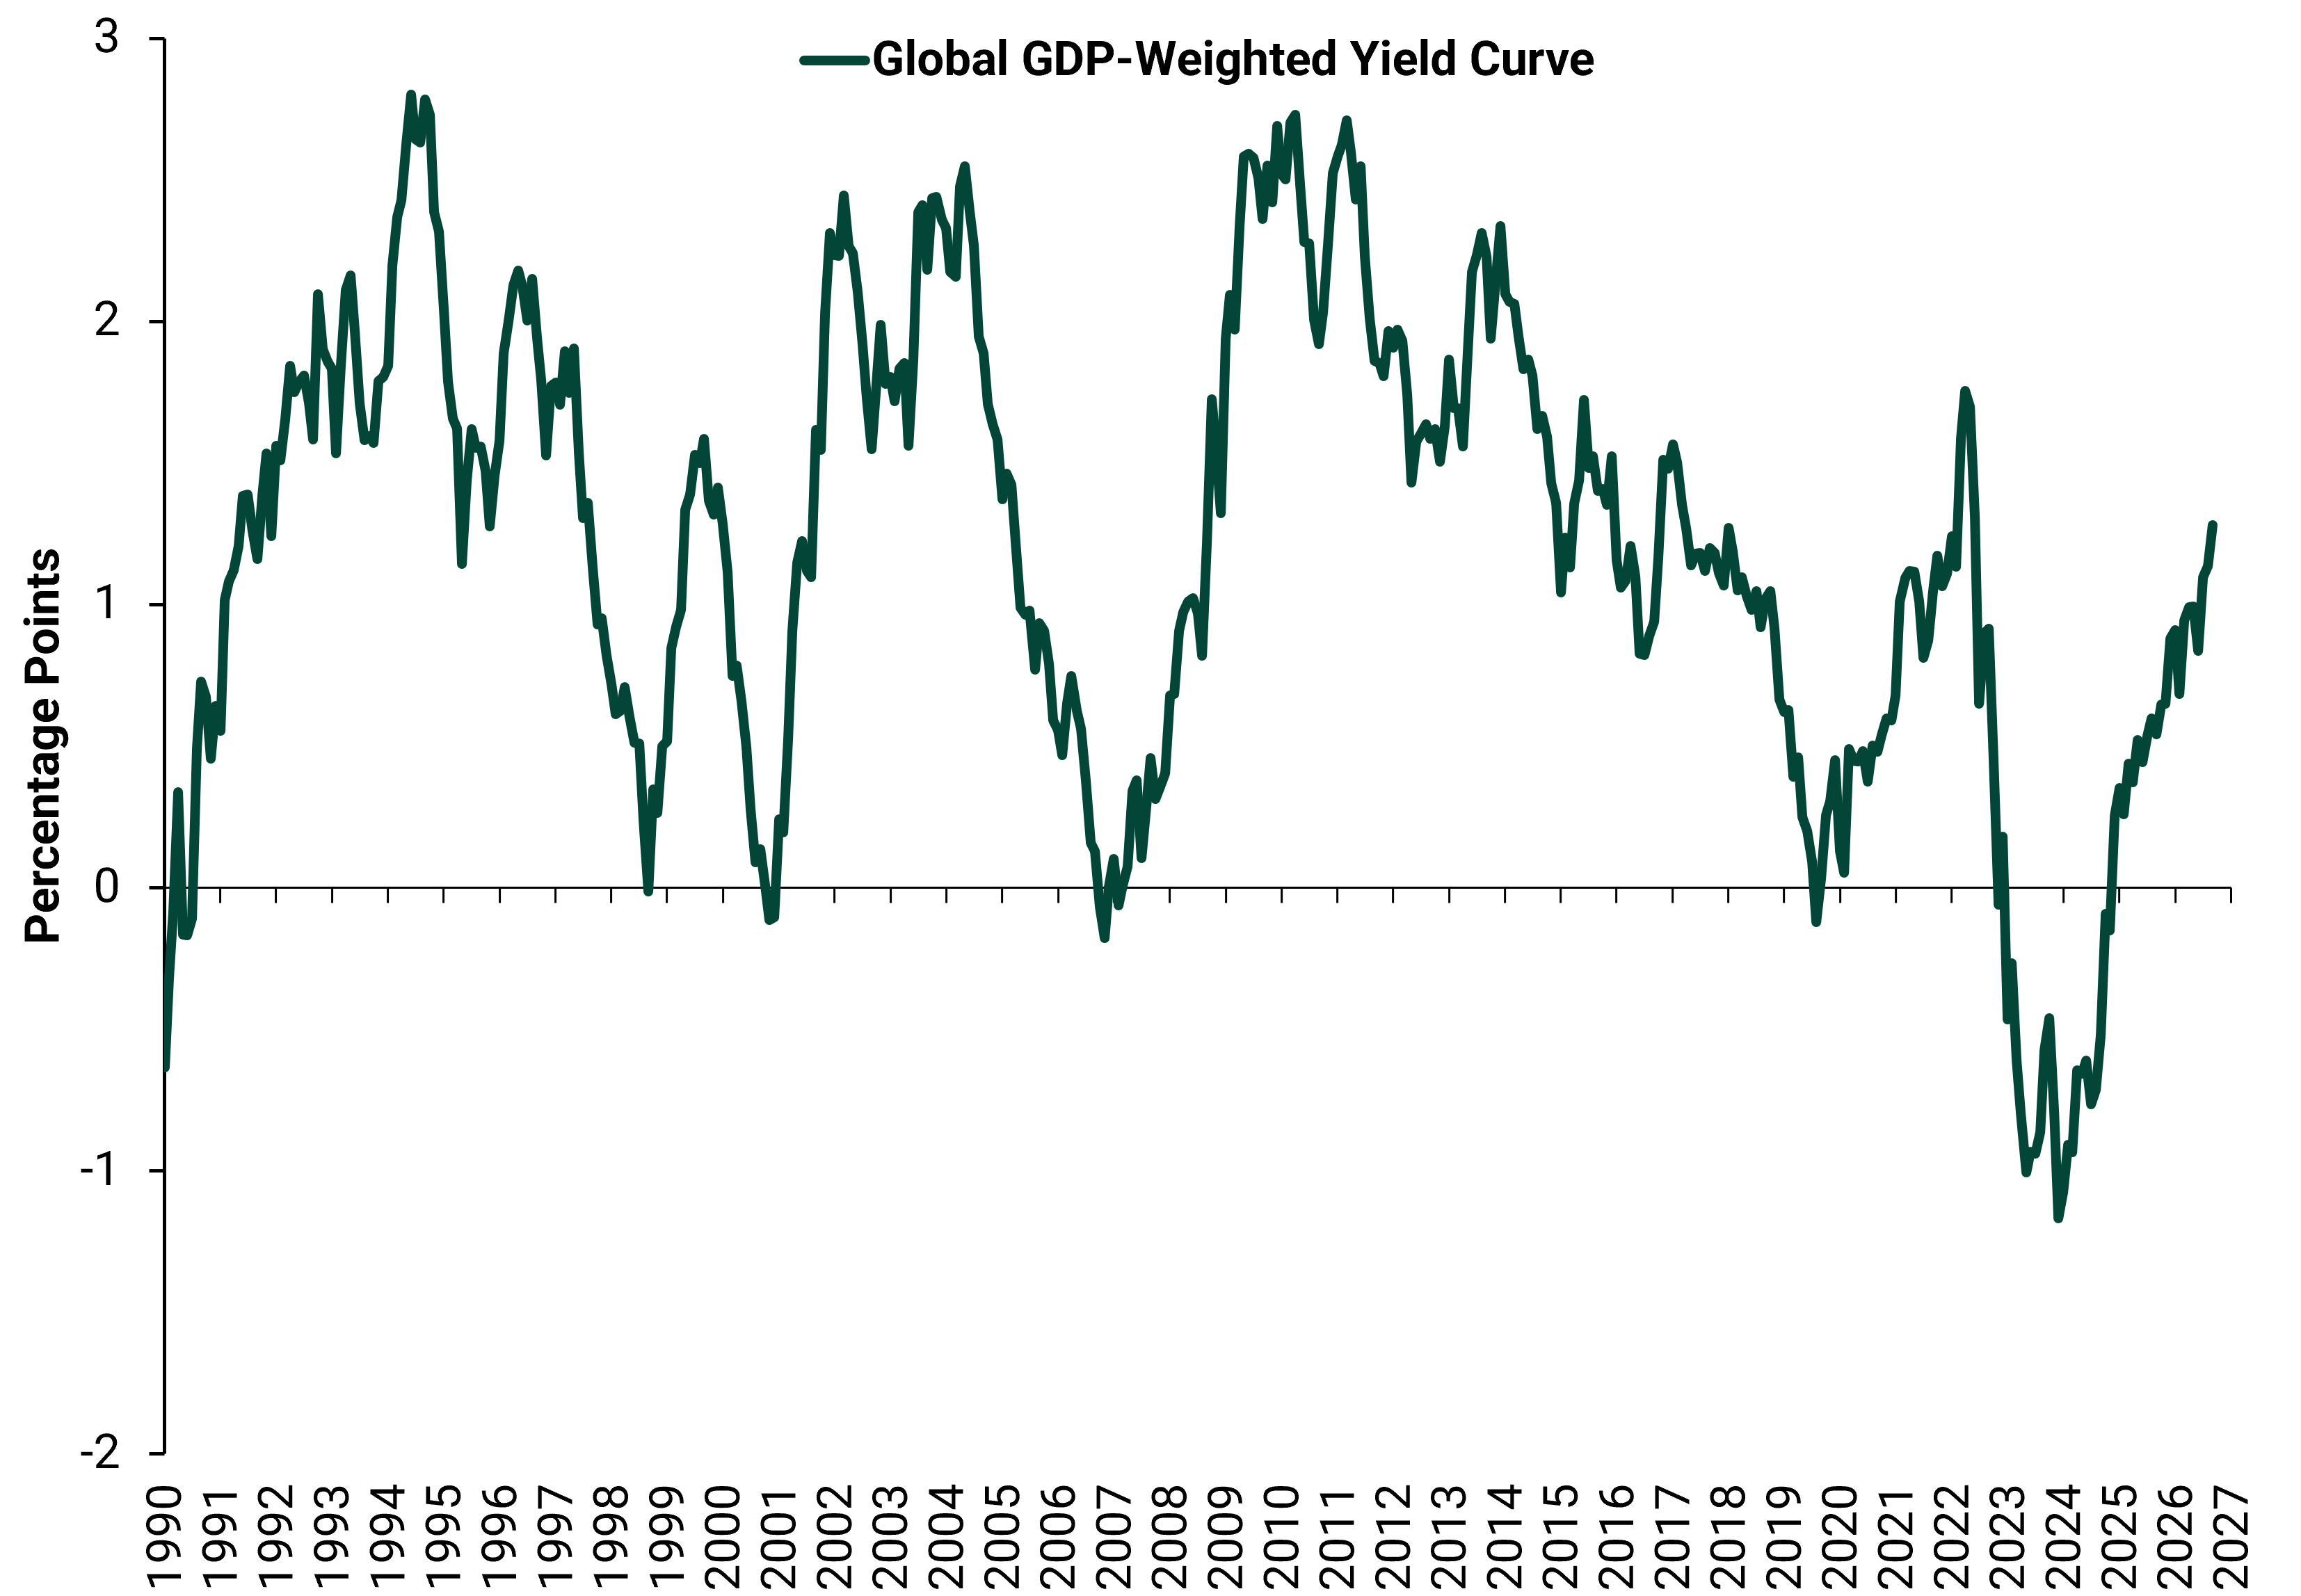
Source: FactSet, as of 11/11/2026. Global GDP-weighted yield spread (10-year minus 3-month government yields), 31/12/1989 – 30/09/2026. GDP, or gross domestic product, is a government measure of economic output. GDP weighting scales rate moves for the size of the respective economy.
Zoom in on the UK. The Bank of England (BoE) hiked its overnight Bank Rate a quarter point to 4.0% on 5 November.[iv] This was its first since 2023, but it follows the Fed, ECB, Bank of Japan, Bank of Canada and Reserve Bank of Australia (RBA).[v] According to many financial publications we read, this supposedly indicates a global tightening cycle is afoot due to energy-driven inflation. But we think this is mistaken. Inflation is caused by too much money chasing too few goods and services.[vi] Absent galloping money supply growth, higher energy prices depress prices elsewhere.[vii] With aggregate global money supply expanding below average historically, prices seem to lack the fuel to run away economywide.[viii]
Regardless, with 5.2% 10-year Gilt yields serving as the reference rate for many long-term loans, British banks’ net interest margins keep generating positive cashflow.[ix] Through September, UK bank lending rose 6.3% y/y, just above the global 6.2% average.[x] Lending to small and medium businesses rose 5.7% y/y, the fastest since COVID’s emergency loan boom.[xi] To us, banks are signalling heathy risk appetite. This could change if BoE hiking continues, but cooling energy prices in recent weeks may stay its hand, which we think would be a positive (if inadvertent) outcome.
Rate hikes Down Under look closer to a tipping point, in our view. The RBA’s quarter point hike last Tuesday took its Cash Rate Target to 4.85%, just under 10-year Australian government bond yields’ 5.0%.[xii] Hikes have substantially flattened the Aussie yield curve. (Exhibit 2) Of course, we find banks generally lend above that benchmark, as it is a credit-risk-free reference rate. No private borrower is credit-risk free, in our experience, so banks add a spread. Still, that suggests to us banks may not be adequately compensated for risk when making new loans to a wide swath of borrowers. More hikes could dissuade further lending.
Exhibit 2: Flattening Yield Curve Down Under Could Slow Credit
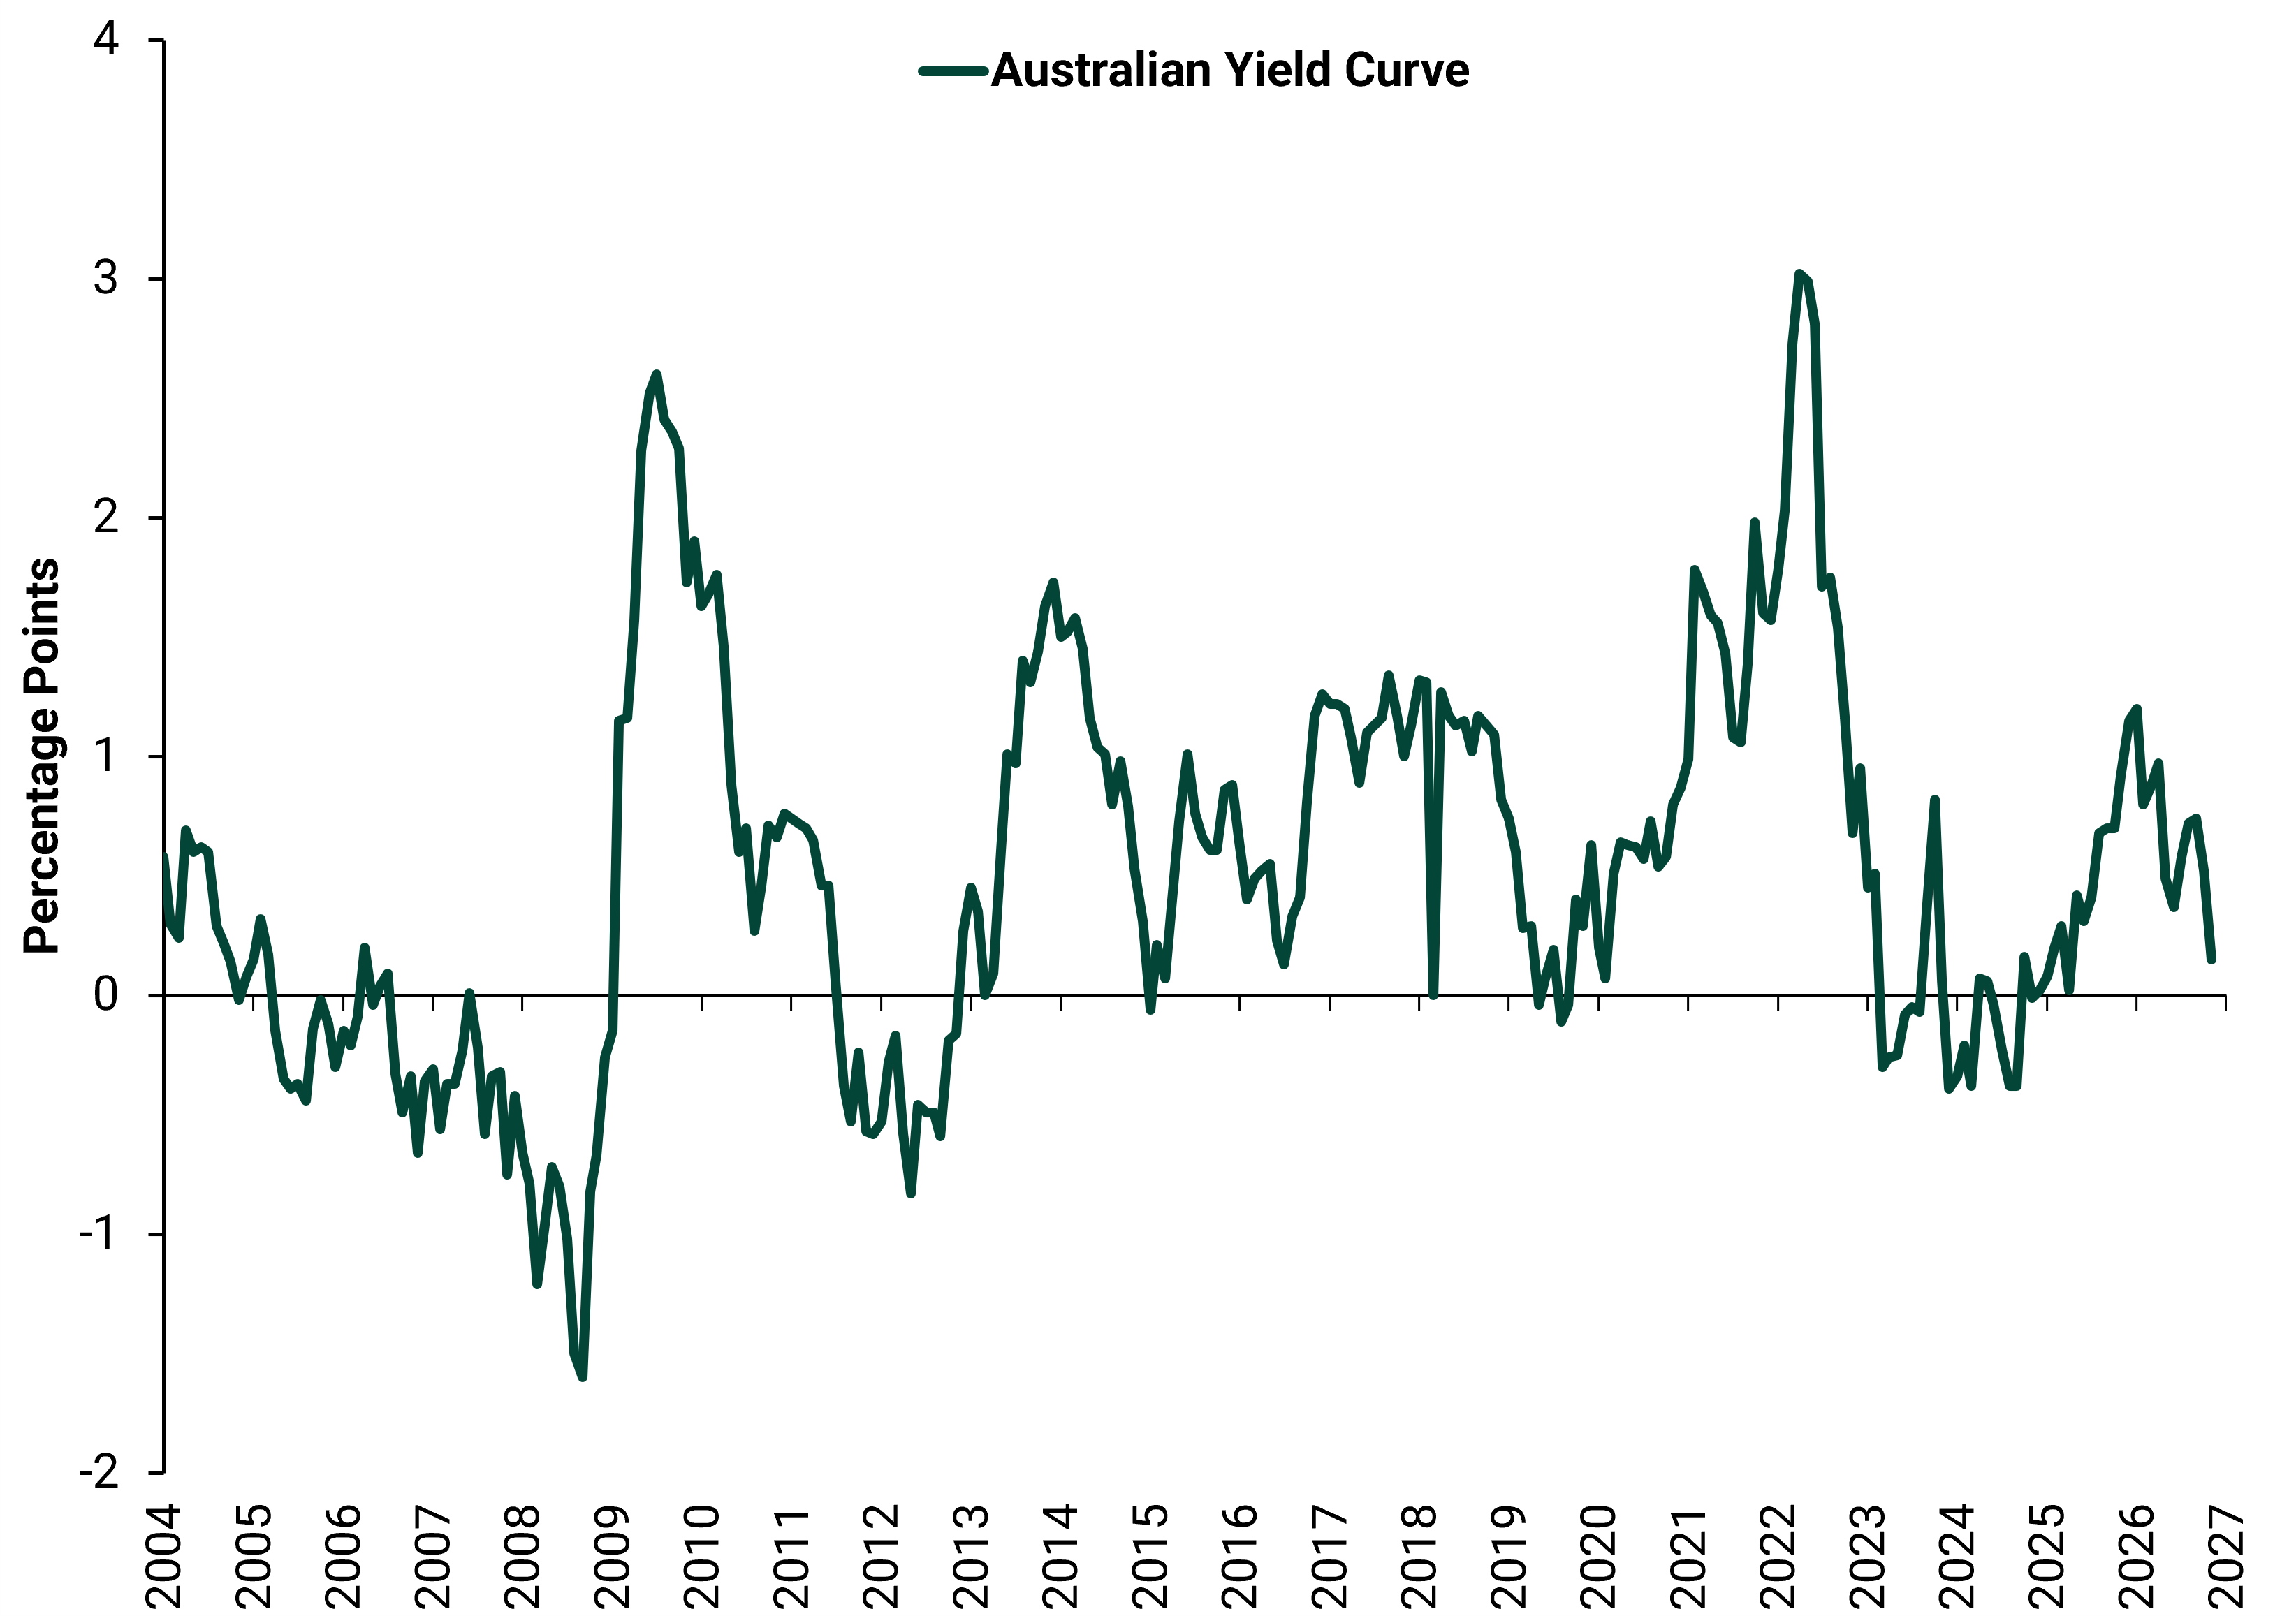
Source: FactSet, as of 11/11/2026. 10-year Australian government bond yield minus Cash Rate Target, 31/12/2003 – 11/11/2026.
Non-financial Australian credit is still growing, though, up 8.0% y/y in September.[xiii] Indeed, year-over-year lending has grown continuously Down Under since at least 2004 despite bouts of yield curve inversion over the last two decades. (Exhibit 2) How could that be? Our research shows banks have access to global funding markets—they can borrow overseas. (And, worth noting, we find Australia’s huge mining sector and banks’ exposure to it helped the Lucky Country dodge recession in 2008, as vast Chinese infrastructure stimulus spilled to Aussie commodity firms.)[xiv] According to our analysis, one country’s yield curve matters less than the global yield curve.
With the global yield curve still positively sloped, we see credit extension likely continuing. And as credit funds future economic activity, we think this points to ongoing global growth. Exhibit 3 shows the pace of lending globally has almost doubled from two years ago as the curve steepened. Now, if the RBA inverts its curve—and more monetary policy institutions join in—risks could mount for global markets. We don’t think that isn’t today, but it is worth monitoring.
Exhibit 3: Global Bank Loan Growth Accelerating
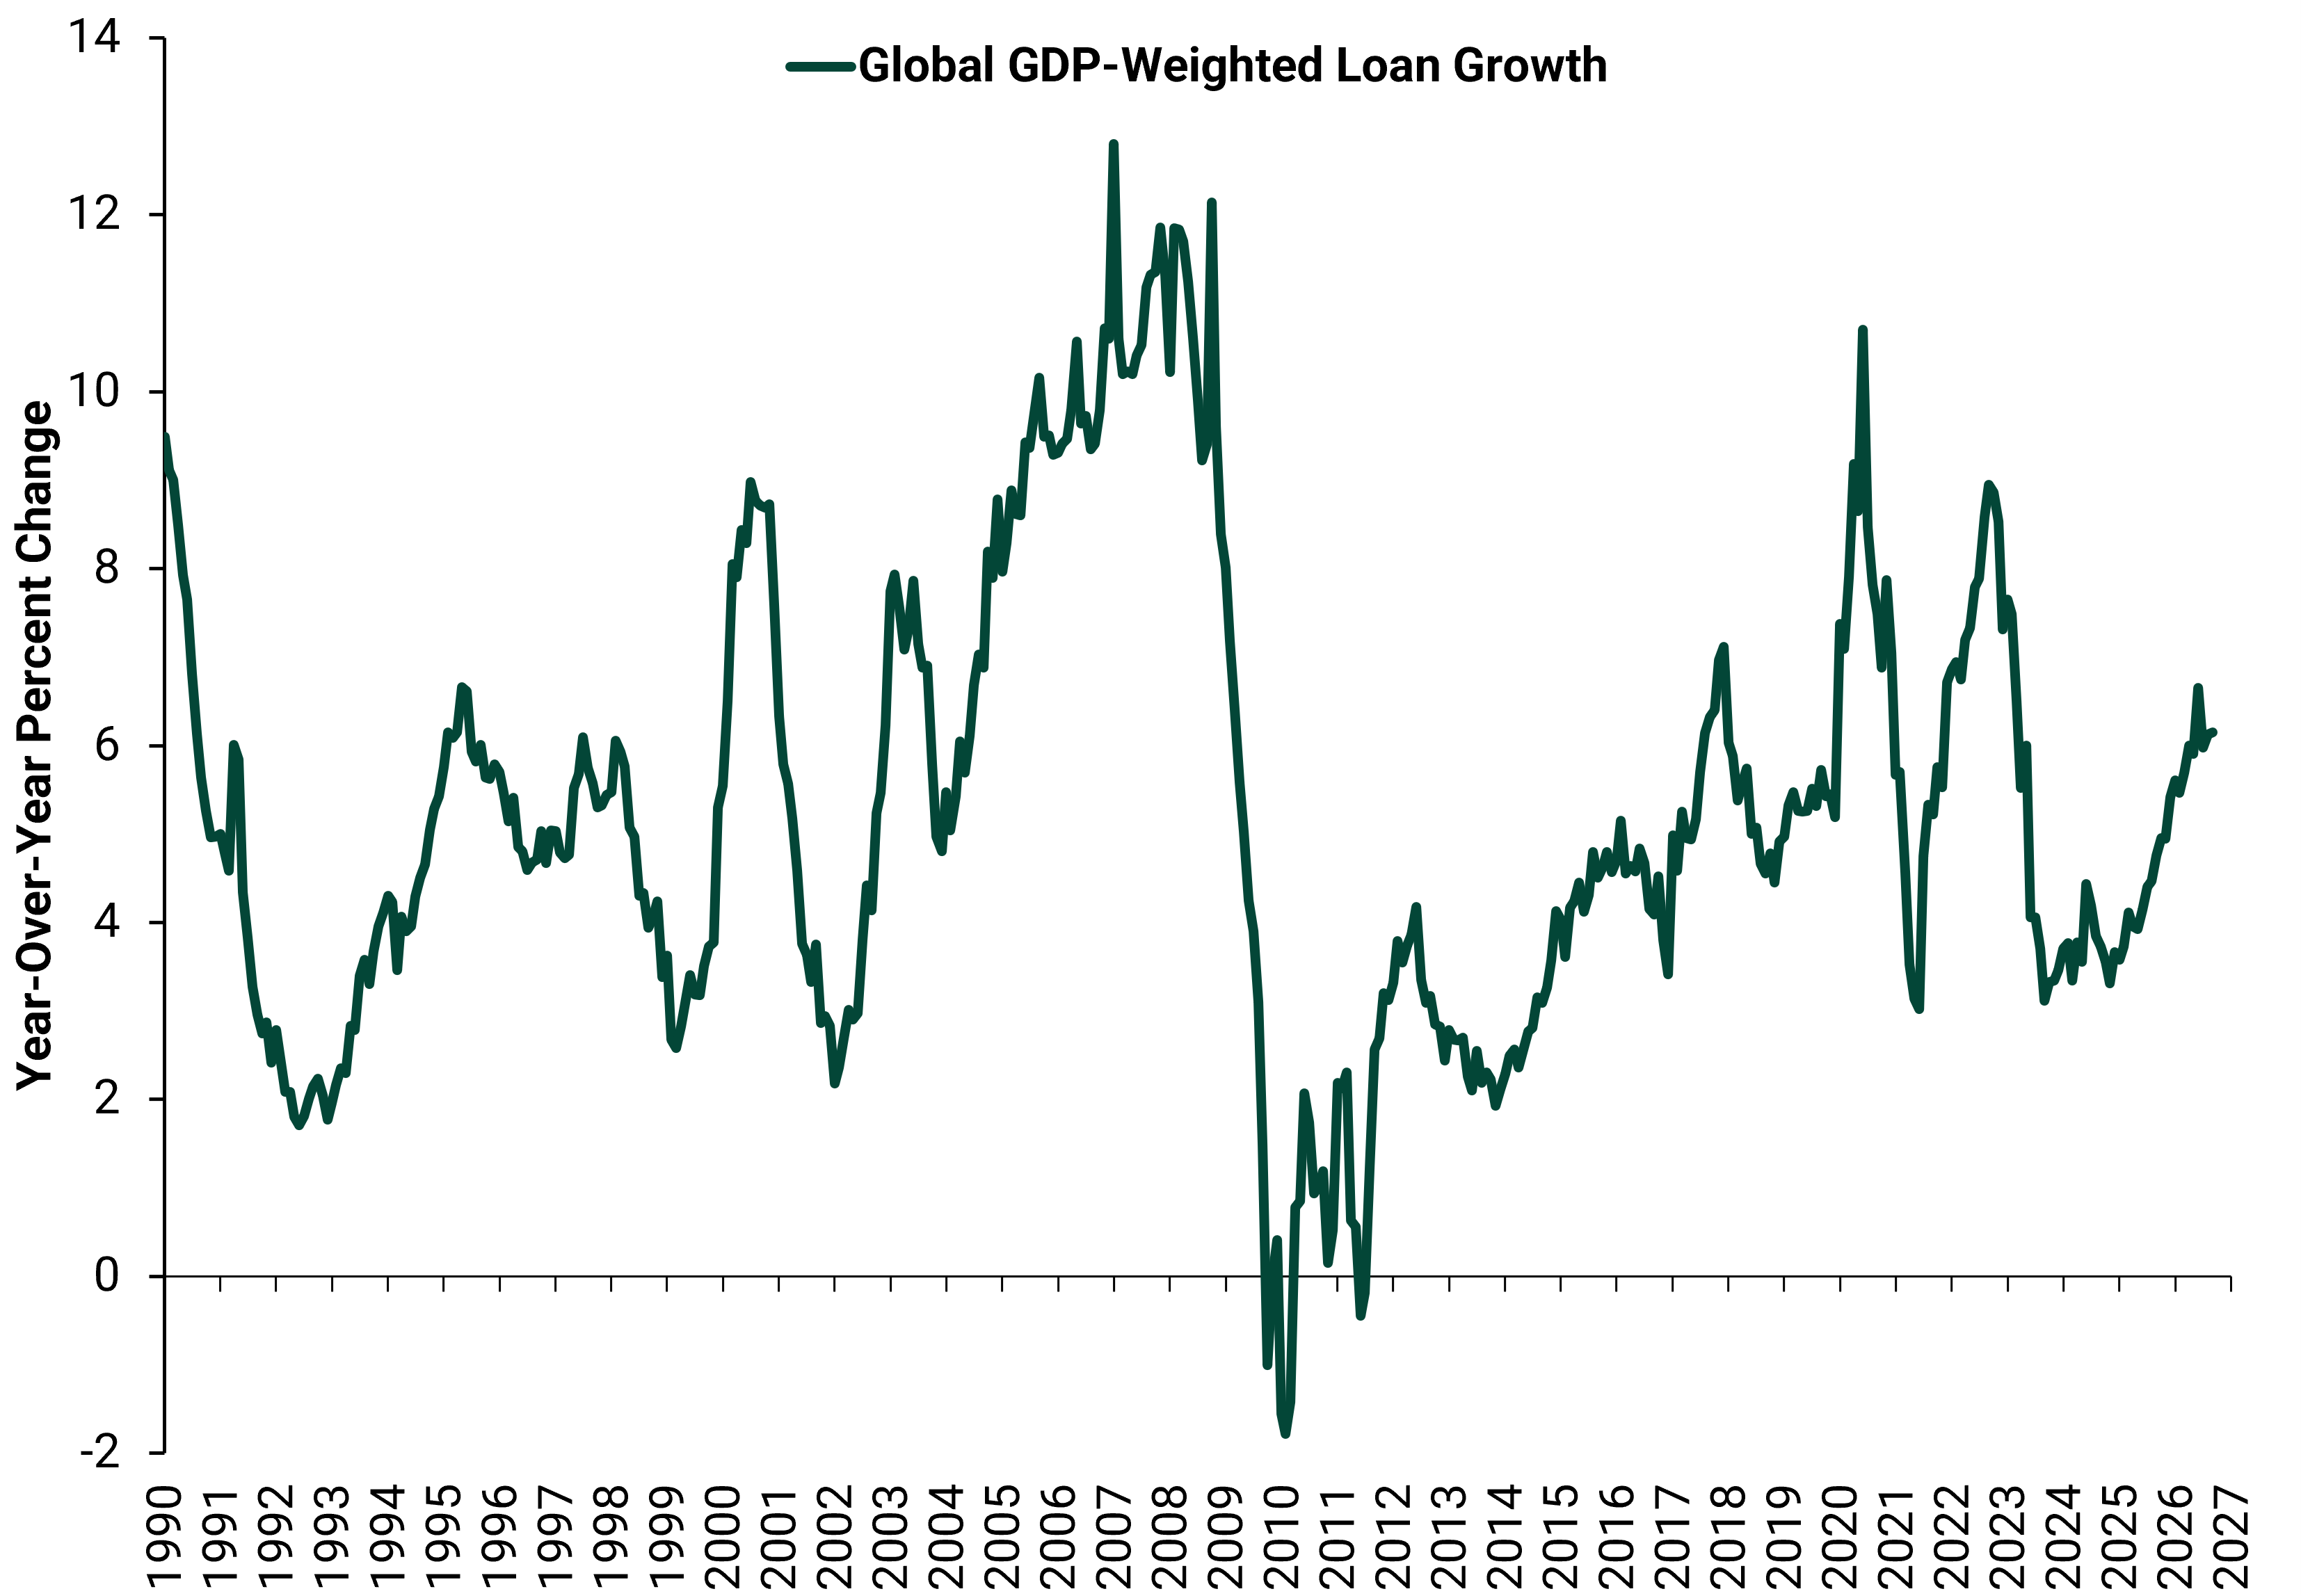
Source: FactSet, as of 11/11/2026. Global GDP-weighted loan growth, 31/12/1989 – 30/09/2026.
[i] Source: BoE, as of 05/11/2026.
[ii] Source: RBA, as of 03/11/2026.
[iii] Source: ECB, Bank of Japan, Bank of Canada and Federal Reserve, as of 11/11/2026.
[iv] See note i.
[v] See notes ii & iii.
[vi] “A Monetary History of the United States,” Anna Schwartz and Milton Friedman, National Bureau of Economic Research, 1963.
[vii] Ibid.
[viii] “Putting Faster Money Supply Growth in Context,” Editorial Staff, Fisher Investments, 29/09/2026.
[ix] Source: FactSet, as of 11/11/2026.
[x] Source: Bank of England and FactSet, as of 11/11/2026.
[xi] Source: Bank of England, as of 11/11/2026.
[xii] Source: FactSet, as of 11/11/2026.
[xiii] Source: FactSet, as of 11/11/2026.
[xiv] “Chinese Macroeconomic Management Through the Crisis and Beyond,” Adam McKissack and Jessica Y. Xu, Asian Pacific Economic Literature, 09 May 2011. A recession is a broadly contracting activity economywide.
If you would like to contact the editors responsible for this article, please click here.
*The content contained in this article represents only the opinions and viewpoints of the Fisher Investments editorial staff.
Get a weekly roundup of our market insights.
Sign up for our weekly email newsletter.

You Imagine Your Future. We Help You Get There.

Markets Are Always Changing—What Can You Do About It?
Get tips for enhancing your strategy, advice for buying and selling and see where we think the market is headed next.
