


Personal Wealth Management / Market Analysis
A Mid-October US Economic Scorecard
Reviewing the latest US data through a non-midterm-centric lens.

US midterm elections are in two weeks and dominate American headlines. That focus also colors market analyses. But what economic reports mean for campaigns isn’t our interest. Nor is it stocks’. Markets care about how data square with expectations over the next 3 – 30 months. And the latest numbers confirm a still-growing US economy entering Q4—even as concerns (e.g., inflation) weigh on some investors’ outlooks. Reality quietly beating expectations is a timeless bull market backdrop.
US Consumers’ Resilience
September retail sales rose 0.8% m/m, trouncing expectations for 0.3%.[i] Gasoline sales (6.4% m/m) led—unsurprising with oil and gas prices still high.[ii] (US retail sales aren’t inflation-adjusted.) However, as we pointed out last week, gasoline alone isn’t driving sales—8 of 13 retail trade categories grew last month. Yes, consumers cut some discretionary spending (e.g., sporting goods, hobby, musical instrument & book stores). But furniture store and food services sales rose. Households aren’t pulling back across the board. They are being choosier about where to deploy discretionary funds.
So we now have seven months of data debunking a popular misperception: higher gas prices wreck household spending. The fear often arises when Middle Eastern conflict erupts. Earlier this year, headlines worried the Iran war’s outbreak—and surging gasoline prices that followed—risked knocking spending. Yet retail sales excluding gasoline stations didn’t fall in March. Or April. They rose in 7 of the past 8 months, with only July slightly in the red.
Volatile gasoline prices grab eyeballs. But the category comprises less than 2% of total US consumer spending. Big picture, gas prices aren’t gamechangers. Nor does higher spending at the pump derail other spending. See Exhibit 1. Since the war began and oil first spiked, sales excluding gasoline are up through September. Same with General Merchandise, Apparel, Furniture and Other Retail (GAFO, which tracks spending at shopping centers and malls)—one proxy for discretionary spending. Granted, these categories aren’t gangbusters. But modest growth defies fears of a big consumer slump.
Exhibit 1: 2026 Retail Sales and Select Categories
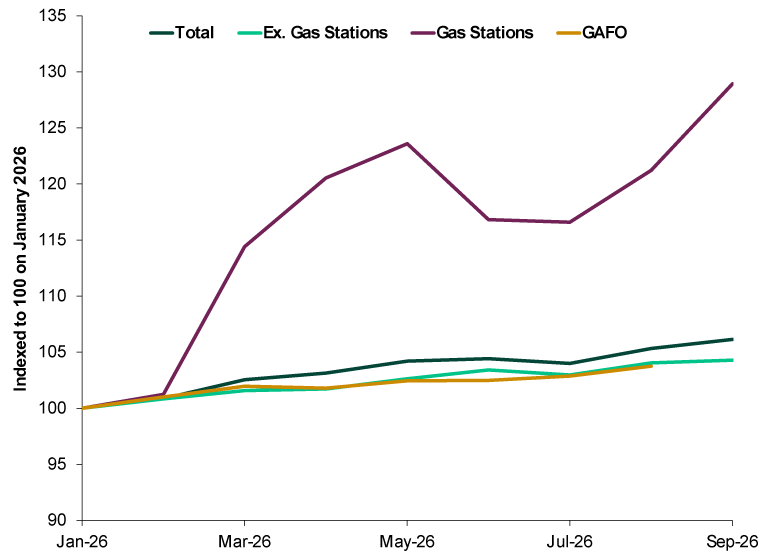
Source: US Census Bureau as of 10/19/2026. US total retail sales, sales excluding gasoline stations, gasoline station sales and General Merchandise, Apparel, Furniture and Other Retail (GAFO) sales, January 2026 – September 2026, indexed to 100 on January 2026. GAFO sales are through August 2026 due to data availability.
Heavy Industry’s Broad-Based Growth
Industrial production grew 0.7% m/m in September, its sixth-straight positive month.[iii] The widely watched manufacturing subsector (0.3% m/m), which comprises 9.5% of US GDP, expanded in eight of the past nine months.[iv] Yet many downplay this, attributing heavy industry’s recent strength to AI, from infrastructure buildouts to semiconductor production.
We agree increased factory production reflects some AI-related spending. The durable manufacturing index, which includes production of metals, machinery and electrical equipment, grew 3.8% annualized in Q3 thanks to semiconductor and related electronic components’ 28.4% gain.[v]
But heavy industry contains other pockets of strength. For instance, no major market group contracted in September. Consumer goods production (0.7% m/m) and nonindustrial supplies (0.9%) rose while business equipment was flat.[vi] Among non-AI categories, manufacturing of food; paper; printing; petroleum and coal; and chemicals products all grew last month.[vii] Manufacturing isn’t a major US GDP driver, but AI alone isn’t propping it up. Similar to Corporate America’s overlooked earnings growth, heavy industry’s broad-based expansion showcases resilient US demand.
How a Story Loses Surprise Power
The Fed released its second-to-last “Beige Book” for 2026. This publication summarizes the central bank’s latest regional economic reports. From a high level, October’s report noted 9 of 12 Fed districts grew while rising prices remained a concern across the country.[viii]
The Beige Book is also a terrific resource for economic anecdotes. For example, the San Francisco Fed recently found, “A Northern California contact observed consultants leaving large and legacy firms to start their own AI-enabled businesses,” while the Dallas Fed shared, “One machinery manufacturer noted that oil companies were spending money at a much higher rate than expected.”[ix] These tidbits don’t tell you about output, but they add color to the hard numbers.
These regional reports also illustrate how a big story loses its surprise power. Consider one of the year’s biggest stories: the Iran war. The Beige Book released on April 15 contained 59 instances of the term “Middle East”—ranging from the conflict’s effect on prices to stoking general uncertainty—a big jump from the prior report’s zero.[x] Since April’s report, “Middle East” fell to 37 references in June, 18 in July, 11 in September and 7 in October.[xi]
The fighting hasn’t ceased, of course. But the steady decline in citations highlights how policymakers, businesses and individuals eventually price in and move on from a well-known development. If Fed regional banks have largely moved on from a story, what does that mean for stocks—which discount widely known information near instantaneously? Keep that in mind when the next big external event jumps into headlines and triggers dire forecasts. The accompanying attention saps surprise power—and stocks move on quickly.
[i] Source: FactSet, as of 10/19/2026.
[ii] Source: Census Bureau and FactSet, as of 10/19/2026.
[iii] See note i.
[iv] Source: BEA, as of 10/19/2026.
[v] Source: Federal Reserve, as of 10/19/2026.
[vi] Ibid.
[vii] Ibid.
[viii] Ibid.
[ix] Ibid. The Beige Book, October 2026.
[x] Source: Federal Reserve, as of 10/19/2026. Note, the Fed released a Beige Book on March 4, days after the war started, so those responses don’t fully reflect reactions to the Middle East conflict.
[xi] Ibid.
If you would like to contact the editors responsible for this article, please message MarketMinder directly.
*The content contained in this article represents only the opinions and viewpoints of the Fisher Investments editorial staff.
Get a weekly roundup of our market insights
Sign up for our weekly e-mail newsletter.

You Imagine Your Future. We Help You Get There.
Are you ready to start your journey to a better financial future?
Where Might the Market Go Next?
Confidently tackle the market’s ups and downs with independent research and analysis that tells you where we think stocks are headed—and why.
Related Resources
-
Market Analysis A Mid-October US Economic Scorecard2026-10-20
-
Weekly Wrap-Up Fisher Investments Reviews: Last Week in Markets — October 12 - October 162026-10-19
-
Expert Commentary This Week in Review | Bull Market Birthday, Q3 Earnings, US Inflation
 2026-10-16
-
Market Analysis Gradually Then Suddenly, UK Budget Clarity Is Coming2026-10-15




Learn More
Learn why 210,000 clients trust us to manage their money and how Fisher Investments and its affiliates may be able to help you achieve your financial goals.
As of 9/30/2026
New to Fisher? Call Us.
Contact Us Today