


Are you ready to start your journey to a better financial future?
Personal Wealth Management / Economics
Q3 US GDP Shows Growth Isn’t Out of Petrol
How America’s economy gained steam last quarter.

Despite high energy prices, Q3 US gross domestic product (GDP) accelerated to 3.4% annualised, undercutting widespread warnings amongst commentators we follow that transport costs (read: oil and diesel prices) sap growth.[i] It wasn’t just AI either, contrary to headlines’ continued claims we read. Broad-based economic expansion reveals underappreciated strength to us—bull market fuel.[ii]
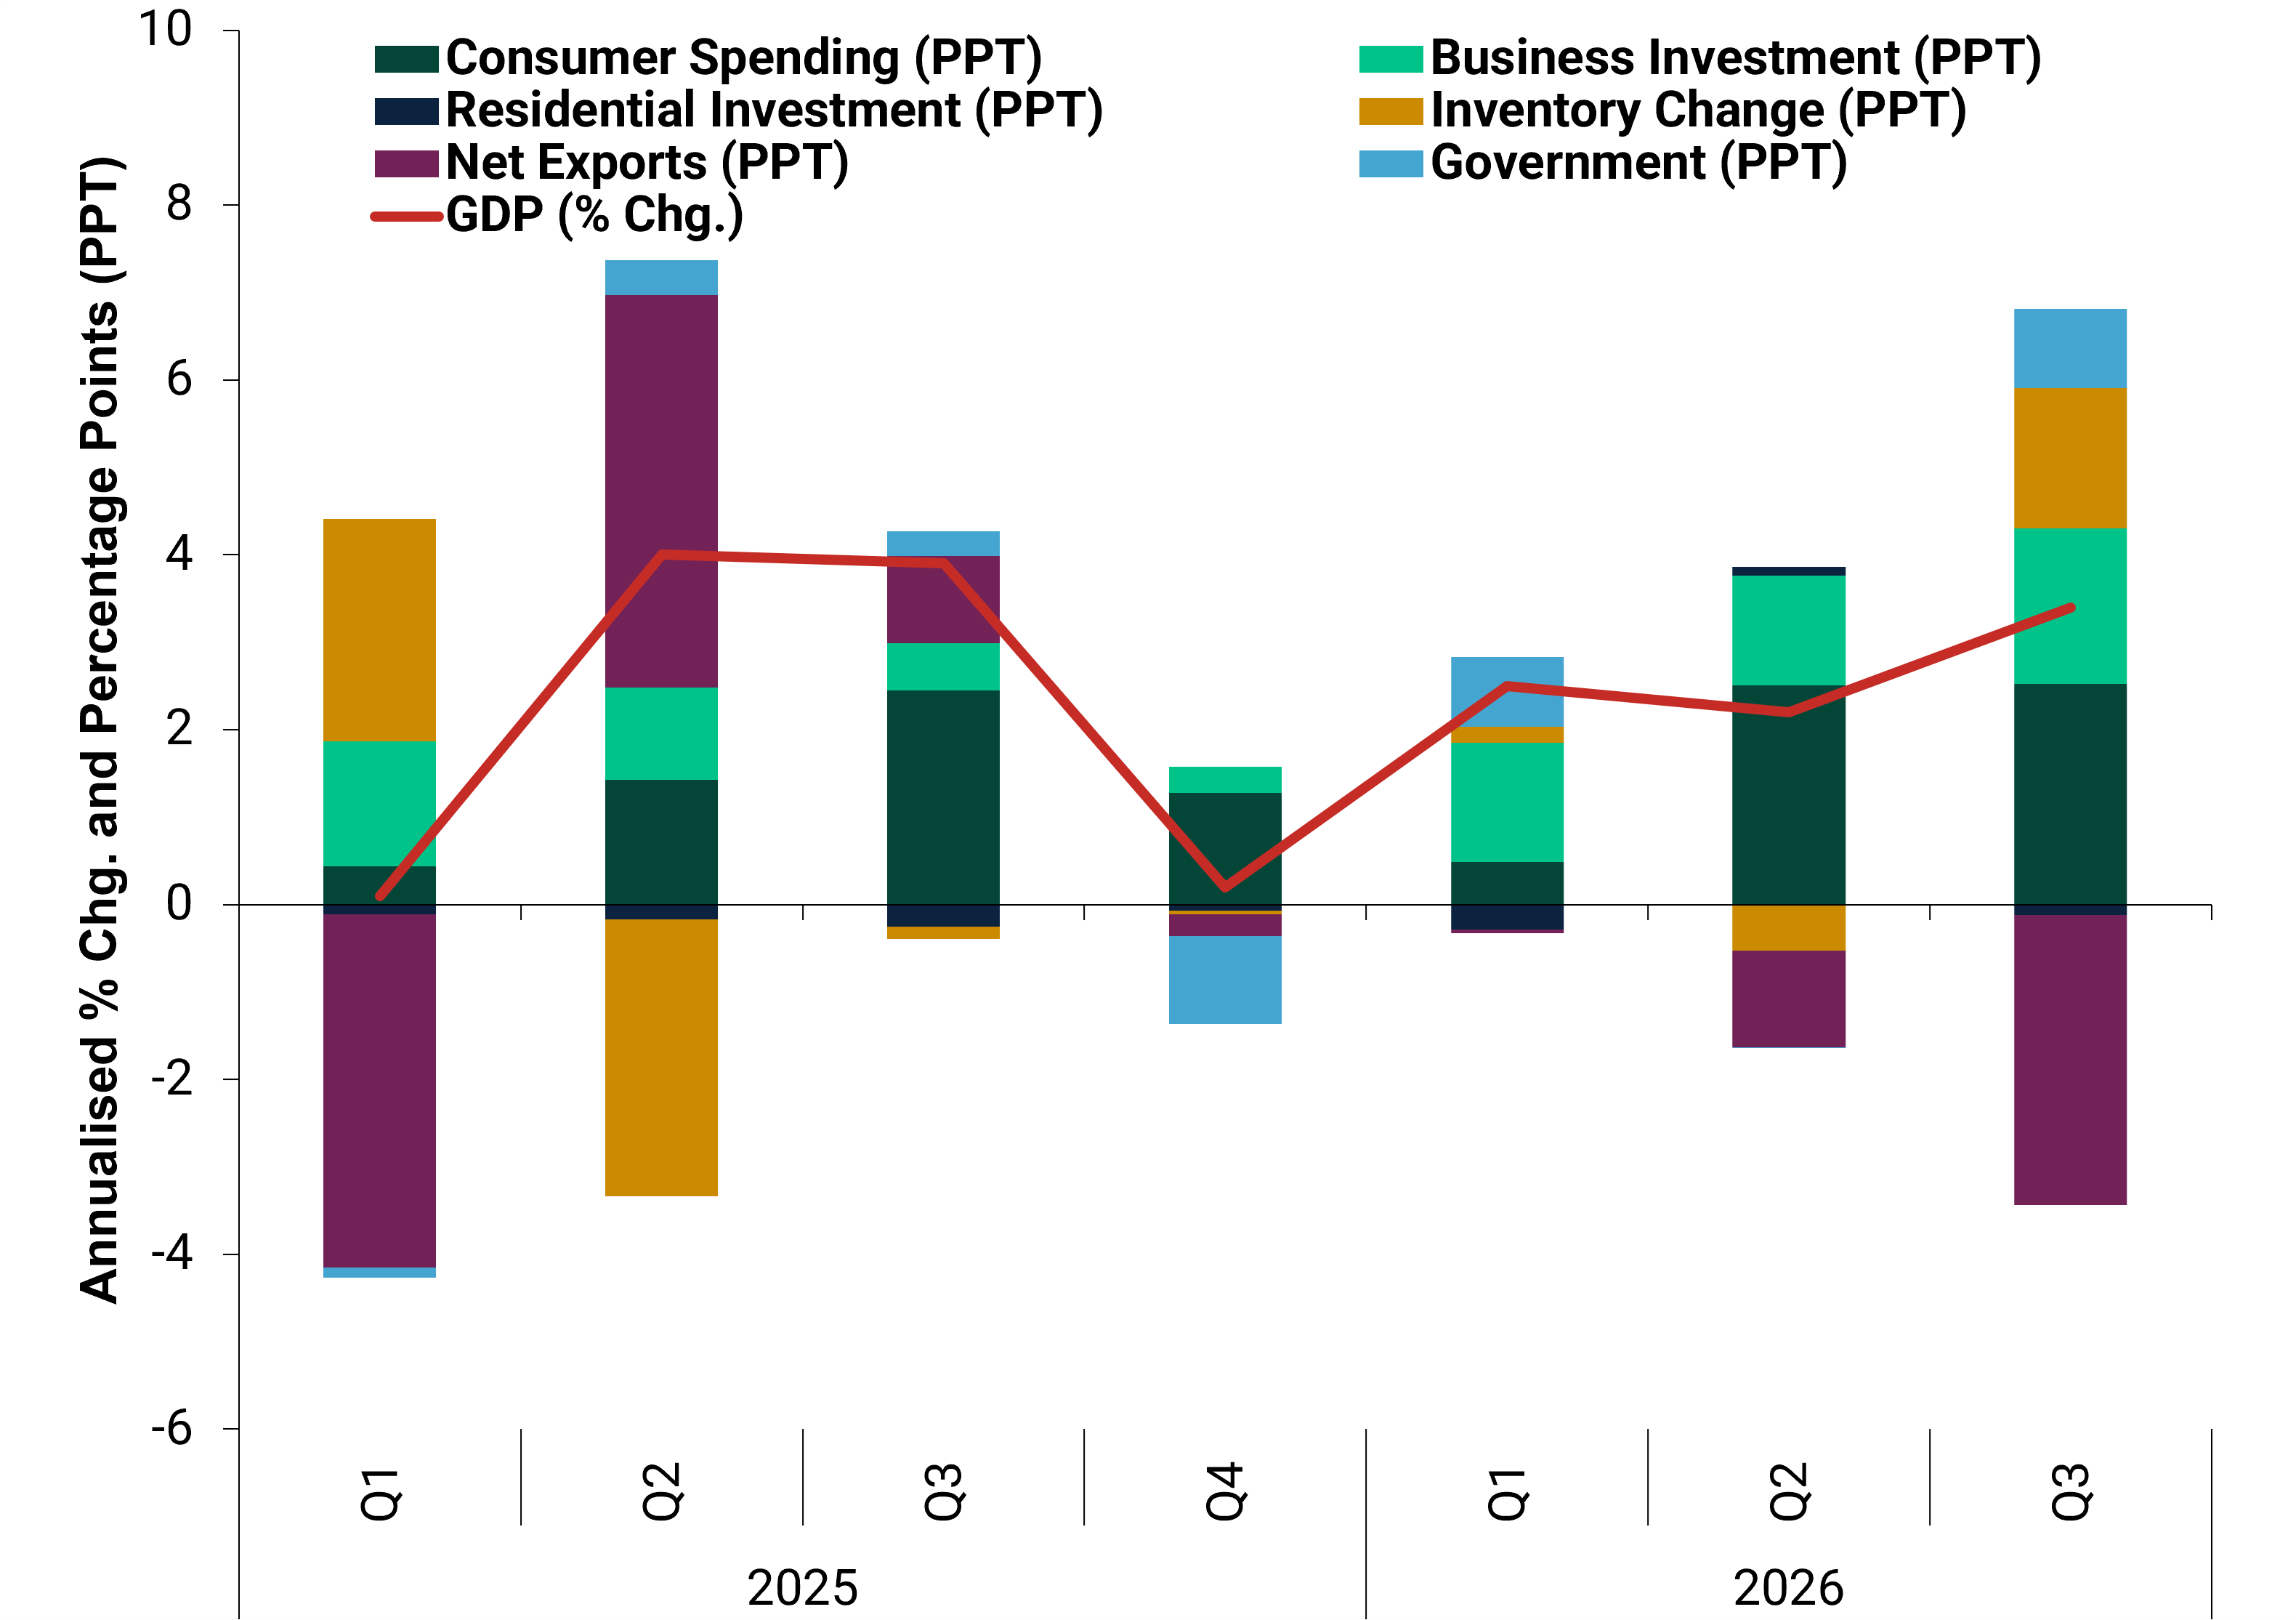
As Exhibit 1 shows, American consumer spending (dark green bars) contributed most to Q3 growth, adding 2.5 percentage points (ppts). Per usual, stalwart services (1.9 ppts) drove US personal consumption expenditures (PCE)—the largest sector in GDP’s biggest category and broadest measure of consumer spending.[iii] Most of this spending is non-discretionary (think healthcare, housing and utilities), which is why PCE generally isn’t the US’s economic swing factor.[iv] Notably, though, food services and accommodations also surged, showing discretionary consumption isn’t weak.[v] Apparently, consumers (in aggregate) aren’t tapped out like headlines we follow say.
Exhibit 1: US GDP and Its Contributing Components
Source: US Bureau of Economic Analysis (BEA), as of 29/10/2026.
US goods spending grew, too.[vi] Motor vehicles, furniture and household equipment contributed most amongst durables (goods designed to last over three years), whilst clothing and footwear led non-durables.[vii] Evidently, energy costs aren’t biting Americans. These are real—inflation-adjusted—gains, not from price increases.[viii] Consider: Nominal consumer spending growth slowed from 9.0% annualised to 5.9%, whilst the real (inflation-adjusted) growth rate stayed at 3.8%.[ix] That rose from 0.7% annualised in Q1, mostly before energy costs jumped.[x] Looks to us like US consumers aren’t as price-sensitive as many commentators we track claim.
Nor is AI the sole driver of American business investment (light green bars, 1.8 ppts). Headlines we read continue claiming it is, arguing this risks lopsided growth, which echoes warnings we see about stock returns and corporate earnings. They imply good times hinge on the data centre boom continuing to ... err ... boom. But we think a deeper dive debunks this.
Information processing equipment (0.9 ppt) was almost half of US business investment’s contribution.[xi] But more than half wasn’t.[xii] Industrial equipment (0.3 ppt) and structures (0.2 ppt) were also a good chunk.[xiii] Now, some of that likely reflects data centre construction, in our view. But commercial and health care structure investment surged 15.2% annualised and oil-related investment soared 19.6%.[xiv] Neither reflects AI.
Then, too, we see no sign of a software apocalypse arising from AI adoption. Many commentators we follow warn AI’s coding skills will render software purchases obsolete because people could prompt AI to design any package they like. But at least through Q3, software and other intellectual property products—R&D and media—continued adding substantially (0.5 ppt) to growth.[xv] Software itself grew 9.6% annualised.[xvi] Maybe in time this changes, but it hasn’t yet.
One persistent area of American weakness: housing.[xvii] As Exhibit 1 shows, though, it has a negligible influence, countering the age-old belief we observe that growth depends on residential real estate. You may have to squint to see the navy blue bars, but that is residential investment’s share. It has detracted in six of last seven quarters. But despite sizable contractions in absolute terms, the influence on overall growth is miniscule. Moreover, from reports we read, it is also well known as rising mortgage rates dampen activity. Although we think it would be nice if high home prices spurred construction, it isn’t necessary for continued growth, as we have seen for years. Housing is just too small a sliver to matter much, according to our research.
Overall, when evaluating GDP, we think investors benefit from focussing on consumption and investment (green bars). These twin engines of private sector domestic demand continue chugging along. US net exports (exports less imports; plum bars) can swing the headline, but we wouldn’t overrate them. More exports are better than not because they represent demand abroad. But don’t read anything into imports’ alleged subtraction. They represent domestic demand—and are already counted as consumption.[xviii] Subtracting them is a wash. Imports’ mathematical effect on GDP is always neutral (although the actual economic effect isn’t neutral at all—they are key inputs to many final products or services).
Inventories (gold bars) may also swing big, but we find that is open to interpretation. Take last year’s big Q1 and Q2 moves. US stockpiling added to its Q1 2025 GDP ahead of tariffs (as imports seemingly detracted). But the effect mostly just reversed the next quarter as imports plummeted (boosting net exports) and businesses drew down pre-tariff stockpiles. We think smaller inventory shifts since show tariff effects mostly in the rearview (as businesses find workarounds).
So what do ongoing consumption and investment growth show investors? High prices—in certain areas—don’t appear to deter US households and businesses or knock America’s broad expansion. The popular narrative we hear that AI masks weakness and overextension elsewhere doesn’t hold water, in our view. Corporate America is making record sales and profits, which households (in aggregate) benefit from as both consumers and investors.[xix] Americans seemingly have the wherewithal to buy what firms offer, and in turn, US businesses are ploughing that back into expanding their offerings.
Strip away the headline noise and the market implication is positive for stocks, in our view. Under America’s bonnet, economic growth is broader and more resilient than headlines we see warn.
[i] Source: BEA, as of 29/10/2026. GDP is a government measure of economic output. Annualised growth is if the quarter-on-quarter growth rate persisted for four quarters.
[ii] A bull market is a period of generally positive stock market returns, as measured by broad indexes.
[iii] Source: BEA, as of 29/10/2026.
[iv] Source: BEA, as of 29/10/2026.
[v] Source: BEA, as of 29/10/2026.
[vi] Source: BEA, as of 29/10/2026.
[vii] Source: BEA, as of 29/10/2026.
[viii] Source: BEA, as of 29/10/2026.
[ix] Source: BEA, as of 29/10/2026.
[x] Source: BEA, as of 29/10/2026.
[xi] Source: BEA, as of 29/10/2026.
[xii] Source: BEA, as of 29/10/2026.
[xiii] Source: BEA, as of 29/10/2026.
[xiv] Source: BEA, as of 29/10/2026.
[xv] Source: BEA, as of 29/10/2026.
[xvi] Source: BEA, as of 29/10/2026.
[xvii] Source: BEA, as of 29/10/2026.
[xviii] “Measuring the Economy: A Primer on GDP and the National Income and Product Accounts,” Penny S. Pritzker, Ken Arnold and Brian C. Moyer, BEA, December 2015.
[xix] Source: FactSet, as of 30/10/2026.
If you would like to contact the editors responsible for this article, please click here.
*The content contained in this article represents only the opinions and viewpoints of the Fisher Investments editorial staff.
Get a weekly roundup of our market insights.
Sign up for our weekly email newsletter.

You Imagine Your Future. We Help You Get There.

Markets Are Always Changing—What Can You Do About It?
Get tips for enhancing your strategy, advice for buying and selling and see where we think the market is headed next.
