


Are you ready to start your journey to a better financial future?
Personal Wealth Management / Market Volatility
The Early Midterm-Year Chop Is On
Volatility is a regular midterm-year feature.

The stock market is cra—wait no the Dow Jones Industrial Average (DJIA) just jumped over 50,000 for the first time Friday. Confused? Disoriented? We suggest making peace with volatility, because this is all pretty normal early in US midterm election years.
Indeed, this week’s returns have been a bit of a rollercoaster. Just yesterday, the S&P 500 closed in the red year to date. Software companies have had it especially bad, leading folks to finally notice they are down since late October … and seemingly blinding everyone to the fact that international markets are actually off to a fine start. That development is a more significant indicator of stocks’ resilience than the Dow’s Friday surge across a round number. (Please just dismiss that one altogether. It is a broken index.)
In any case, yes, 2026 is kind of a grind so far. But it is largely a US grind.
Exhibit 1: Global Returns, Deconstructed
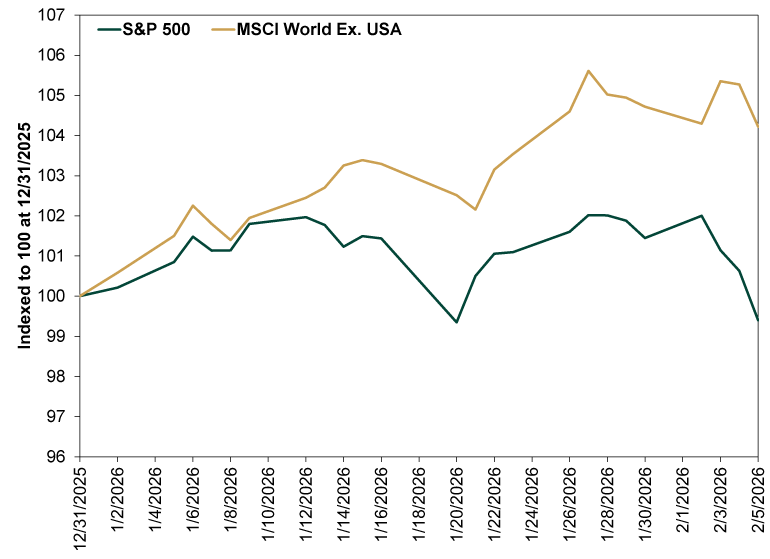
Source: FactSet, as of 2/6/2026. S&P 500 total return index and MSCI World Ex. USA Index with net dividends, 12/31/2025 – 2/5/2026. Indexed to 100 at 12/31/2025.
From this, we can glean two things. One, a big 2025 trend is carrying into 2026. Last year, US stocks trailed international stocks as Europe climbed a higher wall of worry. It is still doing so, even as Software jitters let a little enthusiasm out of the US market’s pressure valve. That isn’t a bad thing, but rather a reminder to be globally diversified. International markets are necessary for broad exposure to Industrials, Materials and other sectors leading the charge early. They are also a broader source of value stocks, also leading year to date. We aren’t telling you this so you can chase heat, but to remind you that the market is a really big, diverse place, and concentrating in any one country, sector or style is an error. And that would be true whether or not US Software was enduring a rocky stretch.
Two, US midterm years can be like this. They often grind early, with high volatility, before the election brings bullish clarity and increased gridlock later. We see several reasons for this. Contentious campaigns can weigh on sentiment in general, making people feel glum and keeping the proverbial animal spirits from stirring. Politicians on both sides also tend to spout big policy ideas as midterms approach, spurring uncertainty as investors digest the possibility of legislative changes creating winners and losers. That weighs on risk-taking, shifting investors into wait-and-see mode. When midterm results start becoming more clear and investors see the high likelihood of increased gridlock over the next two years, that risk aversion starts to fade, lifting returns later in the midterm year and into the next one.
Exhibit 2: Midterm Years’ Average Arduous Trek
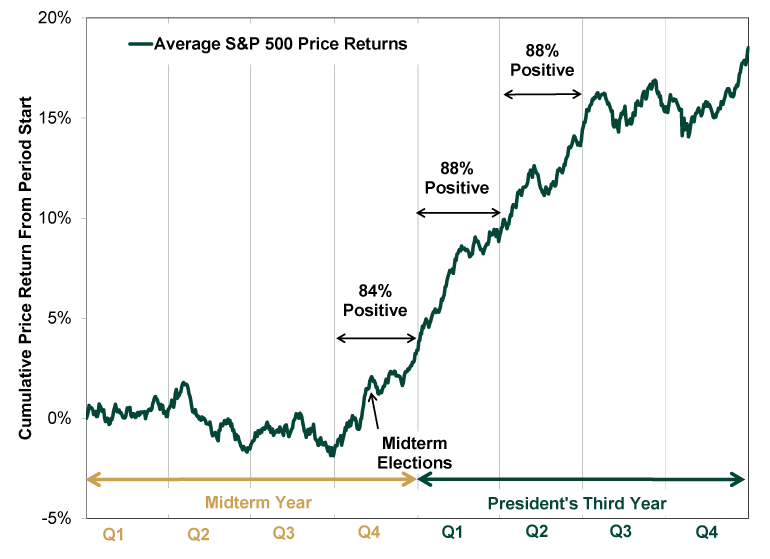
Exhibit 2 Long Description
This line chart displays the comparative financial performance of two major stock indexes, the S&P 500 and the MSCI World Ex. USA, over a short period from December 31, 2025, through February 5, 2026.
- Axes: The vertical y-axis measures the index value, ranging from 96 to 107, with a baseline set at 100 on December 31, 2025. The horizontal x-axis plots time across daily and multi-day increments.
- S&P 500 (Dark Green Line): Starting at 100, the index rises modestly to a local peak of roughly 102 around mid-January. It then undergoes a steady decline, hitting its lowest point on the chart—just under 99.4—around January 20. It recovers back toward 102 by late January but experiences a final sharp drop in early February, finishing at approximately 99.4.
- MSCI World Ex. USA (Gold Line): This index tracks a very similar trajectory to the S&P 500 but remains consistently higher throughout the entire timeframe. After reaching an intermediate peak near 103.4 in mid-January, it dips to around 102.1 on January 20. From there, it rallies sharply to its highest peak of approximately 105.6 in late January. It experiences minor volatility in early February and finishes the period at roughly 104.3.
Source: Finaeon, Inc., as of 8/4/2024. S&P 500 average price return, 12/31/1925 – 12/31/2023.
Now, the early grind to below-average returns depicted in Exhibit 2 doesn’t mean stocks in midterm years are assuredly bad or something to avoid. It is simply an average showing the tendency for years to chop more early than late.
This is another reason global diversification is vital. Midterm risk aversion is mainly a US-centric phenomenon. Across the rest of the world, the electoral calendar is pretty quiet. Japan’s election wraps Sunday, bringing clarity there. The chances of a UK leadership change seemingly went up this week as the blowback over Prime Minister Keir Starmer’s choice of US ambassador intensified tied to Epstein file disclosures, and a switch could lead to a snap election. But that isn’t presently on the calendar, and markets are hard at work pricing these developments. And that uncertainty is an outlier, with few truly free or consequential elections on the docket this year. Overall, political uncertainty is simply lower abroad, an added tailwind for non-US stocks.
As for the volatility on our shores, we recommend everyone breathe, remember these things are normal in midterm years especially, and stay focused on your long-term goals. Short-term volatility comes and goes, and it is the price we all pay for stocks’ superior long-term returns. US markets aren’t risk-free, but those in headlines now are widely discussed, lacking the surprise power typically necessary to cause a bear market. To us, this looks like a normal sentiment grind.
If you would like to contact the editors responsible for this article, please message MarketMinder directly.
*The content contained in this article represents only the opinions and viewpoints of the Fisher Investments editorial staff.
Get a weekly roundup of our market insights.
Sign up for our weekly email newsletter.

You Imagine Your Future. We Help You Get There.

Where Might the Market Go Next?
Confidently tackle the market’s ups and downs with independent research and analysis that tells you where we think stocks are headed—and why.
