Security Selection

Picking the Companies that Make Up Your Portfolio
Fisher Investments applies investment themes through the portfolio construction process, believing the majority of long-term portfolio performance comes from macro decisions. Individual securities are selected to leverage Fisher’s top-down views, which can provide significant value.
Fisher Investments' Security Selection Process Involves:

Security Selection Chart Long Description
This flowchart depicts the security selection process, divided into three stages: Global Macro Driver Analysis, Prospect List Definition, and Security Analysis. It begins with analyzing economic, political, and sentiment drivers to shape portfolio themes, followed by screening securities based on liquidity, solvency, macroeconomic views, and outlier analysis. The final stage identifies firms with unique competitive advantages that align with the portfolio's overarching themes.
Identifying Macro Drivers
Fisher Investments will analyse economic, political, and sentiment drivers to shape portfolio themes and weights. This analysis is applied throughout the individual security selection process.
Prospect List Definition
Basic quantitative screening helps minimise risk and narrow the security prospect list and involves the following steps:
- Screen out any securities with insufficient liquidity or solvency issues.
- Then screen securities based on Fisher Investments’ macro views including valuation and/or style preferences.
- Lastly, conduct an outlier analysis to exclude securities with categorisation, pricing, business activities and/or other characteristics outside of the peer group. This step identifies securities that best leverage Fisher Investments’ higher-level themes.
Strategic Attribute Identification
Fisher Investments seeks firms with underappreciated competitive or comparative advantages relative to peers.
Security Selection
Fisher Investments narrows the prospect list based upon fundamental research, which includes
Strategic Attribute Preferences
Identifying which attributes best leverage Fisher’s portfolio themes.
Attribute Execution Analysis
Determining if the firm’s management has a cohesive, executable plan for exploiting its strategic attribute(s).
Relative Valuation Analysis
Examining current valuations relative to peers, historical trends, and the market.
Operational Risk Assessment
Analysing operational red flags to understand potential risks unrelated to valuations or day-to-day management.
From Opportunity to Reality
The opportunity set for global equities is vast. Learn how Fisher Investments distills the investment universe to build custom portfolios.
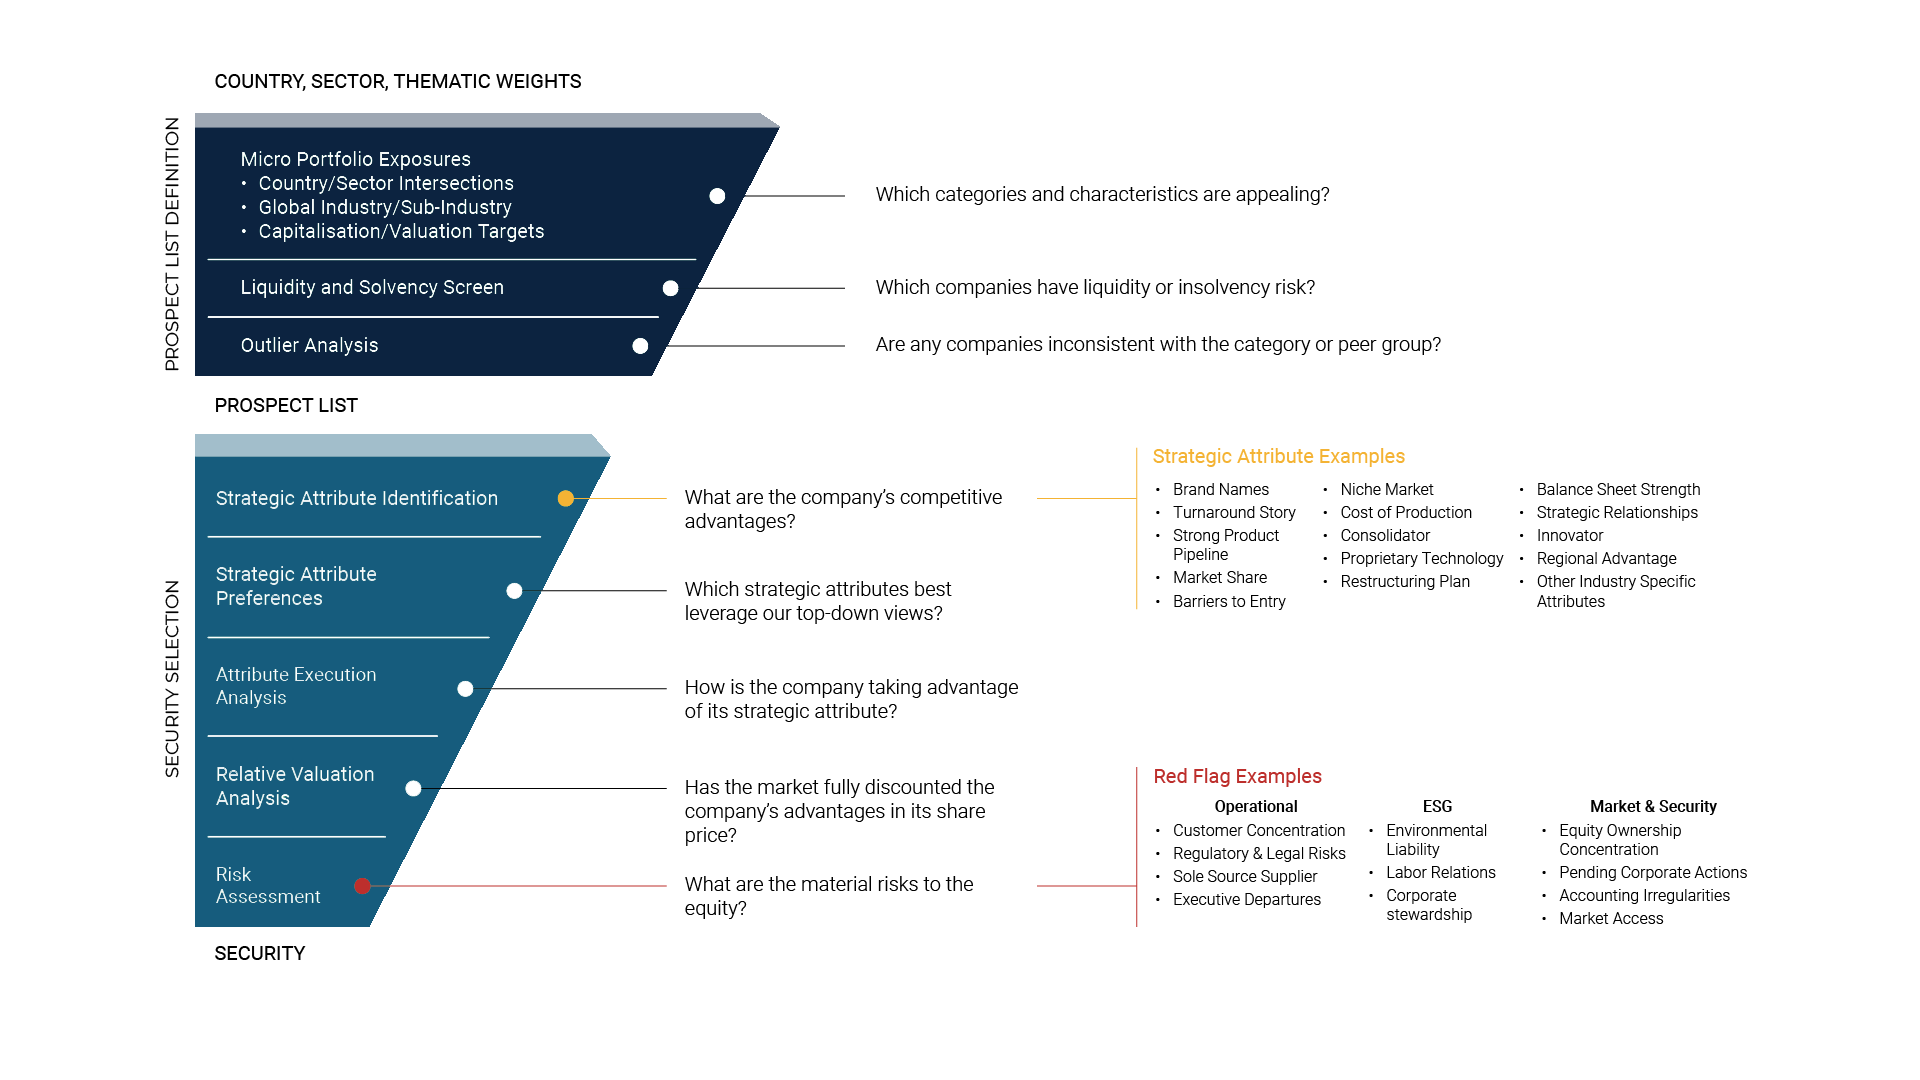
Infographic Long Description 2
This image uses graphic elements and text to communicate the following:
- The steps in Fisher Investments’ investment decision-making process
- The questions the investment team seeks to answer at each step
- The accompanying information they use to answer those questions and arrive at security decisions.
Graphically, a funnel dominates the left side of the image. The funnel is divided into a darker top-third and a lighter bottom two-thirds. Questions and bullet-point lists populate the right-hand side of the image, connected with lines to text inside the funnel.
The upper portion of the funnel shows that the top-down investment process begins with analysis of country, sector and thematic weights to arrive at a list of potential investable securities. A label reading “Country, Sector, Thematic Weights” tops the funnel. Along the side, the label reads “Prospect List Definition.”
The first step in the funnel is “Micro Portfolio Exposures.” It includes three points:
- Country/Sector Intersections
- Global Industry/Sub-Industry
- Capitalization/Valuation Targets.
At this step, the investment team seeks to answer the question “Which categories and characteristics are appealing?”
The next step is “Liquidity and Solvency Screen,” which helps the investment team determine “Which companies have liquidity or insolvency risk?”
The final step of the “Prospect List Definition” portion of the funnel reads “Outlier Analysis.” At this step, the investment team asks, “Are any companies inconsistent with the category or peer group?”
The lower portion of the funnel (Security Selection) comprises five steps. The first step is “Strategic Attribute Identification.” The question answered at this point is “What are the company’s competitive advantages?” A connected bullet-point list details examples of these strategic attributes:
- Brand Names
- Turnaround Story
- Strong Product Pipeline
- Market Share
- Barriers to Entry
- Niche Market
- Cost of Production
- Consolidator
- Proprietary Technology
- Restructuring Plan
- Balance Sheet Strength
- Strategic Partnerships
- Innovator
- Regional Advantage
- Other Industry-Specific Attributes
The second step in the Security Selection portion of the funnel is “Strategic Attribute Preferences.” At this step, the investment team seeks to answer the question “Which strategic attributes best leverage our top-down views?”
The third step is “Attribute Execution Analysis.” Here, the investment team asks, “How is the company taking advantage of its strategic attribute?”
The fourth step is “Relative Valuation Analysis.” The question accompanying this step is “Has the market fully discounted the company’s advantages in its share price?”
The last step is “Risk Assessment.” The accompanying question is “What are the material risks to the equity?” Next to the question are examples of these “Red Flags,” broken out into three main categories: Operational; Environmental, Social, and Governance (ESG); and Market and Security.
- Operational
- Customer Concentration
- Regulatory and Legal Risks
- Sole Source Supplier
- Executive Departures
- ESG
- Environmental Liability
- Labor Relations
- Corporate Stewardship
- Market and Security
- Equity Ownership Concentration
- Pending Corporate Actions
- Accounting Irregularities
- Market Access
At the bottom of the lower portion of the funnel is the label “Security.”
Nieuws en inzichten
-
Bedrijfsinformatie Het Fisher-verschil: de achtergrond van Fisher
 2026-07-14
 -
Bedrijfsinformatie Hoe ons klantgerichte servicemodel van de private client group voordelen oplevert voor onze cliënten
 2026-07-08
 -
Bedrijfsinformatie Welke unieke inzichten biedt Fisher Investments haar cliënten?
 2026-05-28
 -
Commentaar van experts Een voortdurend streven naar beter
 2026-05-28
