Personal Wealth Management / Economics
A Q1 US Growth Check-In
A look at US retail sales and industrial production.
US retail sales and industrial production for February came out last week, and we don’t think they are anything to write home about. Like other indicators lately, we found them mixed. But they also don’t look to us like the US economy is on the precipice of recession, and closer inspection suggests economic reality entering March was better than commonly perceived amongst commentators we follow.
Headline results were, in a word, blah (to use a technical term), in our view. Retail sales fell -0.4% m/m, but that followed January’s big, upwardly revised 3.2% jump.[i] Both of those monthly moves were led by autos.[ii] After surging 7.8% m/m in January, car sales slipped -2.0% last month.[iii] We don’t think autos’ erratic swings in recent months—as supply chains get back in gear—reflect overall retail sales’ underlying trend. Hence, some economists try to isolate core retail sales, which excludes volatile autos, petrol, building materials and food services. This rose 0.5% m/m after January’s 2.3%.[iv]
Either way, we wouldn’t overrate US retail sales—headline or core—because they omit many services, which comprise most consumer spending.[v] They also aren’t inflation adjusted.[vi] But from the data, we don’t see February’s headline giveback—whilst steadier underlying components continued rising—as a sign things suddenly deteriorated.
Meanwhile, industrial production was flat in February, following January’s 0.3% m/m increase.[vii] The lack of growth was mainly due to mining weakness, as the industry’s output declined -0.6% m/m.[viii] Oil and gas extraction and other mining activities fell across the board.[ix] With oil and other raw material prices down, we don’t think that is very surprising.[x] Offsetting mining’s dip, manufacturing ticked 0.1% m/m higher, and utilities rose 0.5%.[xi]
Like its monthly move, industrial production’s overall trend has been ho-hum, drifting mostly sideways.[xii] From a year ago, factory output is -0.2% lower.[xiii] At just 15% of gross domestic product (GDP), though, industrial production isn’t anywhere near as big an engine for the economy as services’ 71%.[xiv]
For a sense of how incoming monthly data affect overall growth, the US Federal Reserve’s (Fed) Atlanta branch’s GDPNow model estimates their impact on US GDP. GDPNow is an experimental metric that attempts to track GDP growth in close to real-time as various economic data that feed into the GDP report are released. Whilst Friday’s industrial production data haven’t been incorporated yet, as GDPNow’s latest update is through 16 March, last Wednesday’s retail sales report—alongside the US Bureau of Labor Statistic’s producer price index (PPI) release—bumped up its Q1 GDP estimate to 3.2% annualised from 2.8%.[xv] (Exhibit 1) PPI contributes to inflation adjustments, and its unexpected -0.1% m/m decline in February appears to have helped boost the model’s estimate for real GDP.[xvi]
Exhibit 1: Evolution of Atlanta Fed GDPNow Q1 US GDP Estimate
Source: US Federal Reserve Bank of Atlanta and FactSet, as of 17/3/2023. *Range of top 10 and bottom 10 average forecasts.
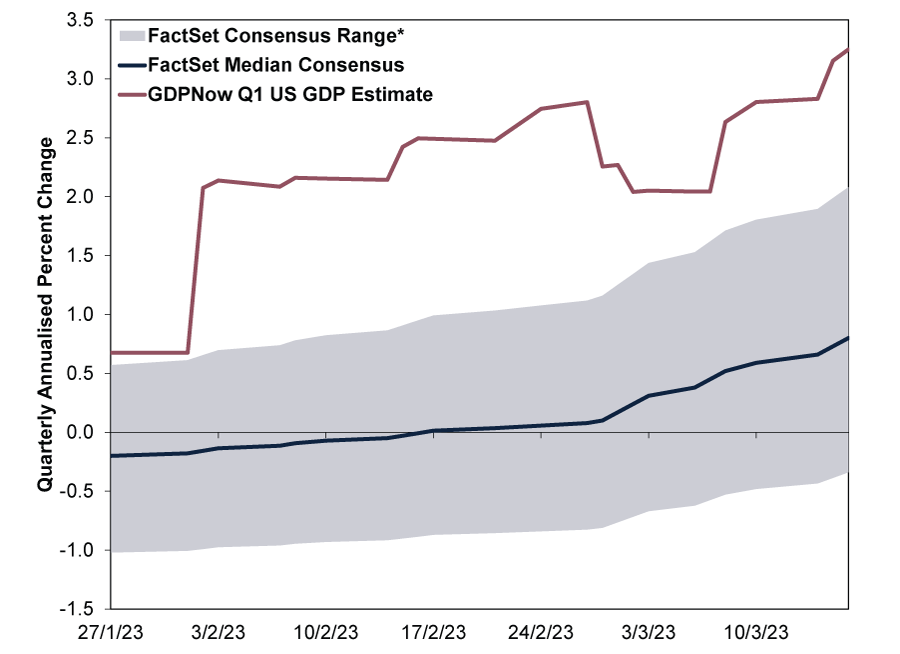
Keep in mind, GDPNow isn’t airtight, based on our research. The Atlanta Fed branch is quick to point out: “As more monthly source data becomes available, the GDPNow forecast for a particular quarter evolves and generally becomes more accurate. That said, the forecasting error can still be substantial just prior to the ‘advance’ GDP estimate release.”[xvii] It relies on historical relationships—which we find often don’t hold, like during a global pandemic and its aftermath. This is why the New York Fed branch iced its competing Nowcast.[xviii]
But with normalcy resuming, in our view, model estimates may get closer to the mark—and they also mirror private-sector forecasts’ improvement from slight contraction at Q1’s start to ongoing expansion.[xix] The wild card to us here is the US Bureau of Economic Analysis’s long-running issues with Q1 seasonal adjustments, which could result in a contraction if those issues aren’t fixed.[xx] But even with that caveat, we think the broad swath of data out so far suggests the economy was faring better than anticipated entering March.
[i] Source: FactSet, as of 17/3/2023.
[ii] Ibid.
[iii] Ibid.
[iv] Ibid.
[v] Source: US Bureau of Economic Analysis, as of 17/3/2023.
[vi] Source: US Census Bureau, as of 17/3/2023.
[vii] Source: US Federal Reserve, as of 17/3/2023.
[viii] Ibid.
[ix] Ibid.
[x] Source: FactSet, as of 17/3/2023. Statement based on S&P GSCI Index.
[xi] See note vii.
[xii] Ibid.
[xiii] Ibid.
[xiv] See note v. GDP is governments’ measure of countries’ economic output.
[xv] Annualised growth rates represent the rate at which GDP would grow over a full year if the quarter-over-quarter percent change repeated all four quarters.
[xvi] Source: US Bureau of Labor Statistics, as of 17/3/2023.
[xvii] Source: US Federal Reserve Bank of Atlanta, as of 17/3/2023.
[xviii] Source: US Federal Reserve Bank of New York, as of 17/3/2023.
[xix] See note i.
[xx] “Assessing Residual Seasonality in the US National Income and Product Account Aggregates,” Baoline Chen, Tucker S. McElroy and Osbert C. Pang, US Bureau of Economic Analysis, January 2021.
Get a weekly roundup of our market insights.
Sign up for our weekly e-mail newsletter.

You Imagine Your Future. We Help You Get There.
Are you ready to start your journey to a better financial future?

Markets Are Always Changing—What Can You Do About It?
Get tips for enhancing your strategy, advice for buying and selling and see where we think the market is headed next.
Related Resources
-
Macro Insights Q1 2026 Global Markets Review & Outlook2026-05-12
-
Macro Insights Why Global Small Cap2026-05-07
-
Market Analysis What to Think of Another Aussie Rate Hike2026-05-05
-
Market Analysis Europe’s Resilient Q1 GDP2026-05-01


Contact Us
Learn why 200,000 clients trust Fisher Investments and its affiliates to manage their money and find out how we may be able to help you achieve your financial goals.
As of 31/03/2026. Includes Fisher Investments and its affiliates.
New to Fisher? Call Us.
Contact Us Today