Personal Wealth Management / Market Analysis
Inside the UK’s Big Inflation Jump
In our view, October’s biggest price pressures appear unlikely to last indefinitely.
The Office for National Statistics released UK October inflation data today, revealing the Consumer Price Index (CPI) inflation rate jumped to 4.2% y/y from September’s 3.1%.[i] (CPI is a government-produced estimate of goods and services prices across the broad economy.) Many financial commentators we follow portrayed it as a worrisome development for the UK economy, warning the acceleration was a sign fast inflation is not “transitory,” which is the word policymakers use most often to describe fleeting price rises. Indeed, for households facing rising costs, high inflation is probably most unwelcome. But we also don’t see much to suggest that it will stick around indefinitely. In our view, the price increases driving October’s accelerating inflation are unlikely to repeat in perpetuity. Should that be the case, simple math suggests they will eventually fall out of the inflation rate. Let us discuss and show how this works.
When assessing short-term inflation drivers, we think it is best to examine the month-on-month price change in various categories, as it avoids the backward-looking skew that can accompany the year-on-year rate (by sheer virtue of having year-old data in the calculation). In October, CPI rose 1.1% m/m, with energy prices amongst the primary causes.[ii] Prices in the category of “Electricity, Gas & Other Fuels” rose 11.9% m/m.[iii] The measure of CPI less energy and unprocessed food rose only 0.6% m/m, little more than half the total month-on-month inflation rate, yet food prices rose only 0.5% m/m.[iv] In our view, this is a strong indication of fuel and electricity’s severe impact on the headline inflation rate.
Yet energy wasn’t the only culprit. Echoing a recent trend in America, prices of second-hand cars rose 4.6% m/m, bringing their total rise since April to 27.4%.[v] Most analysts we follow pin this on a shortage of new vehicles due to the global run on semiconductors, making it a case of the global supply chain crunch driving consumer prices higher—a conclusion we generally agree with. Also echoing America’s experience earlier this year, categories with ties to the easing of COVID restrictions—including air travel (5.5% m/m) and restaurants & hotels (1.1%)—contributed to the headline inflation rate.[vi] In America, we found that these categories accelerated when restrictions eased because the rapid recovery in demand exceeded supply—then the price increases slowed when consumer habits returned to normal and the hospitality sector increased staffing.[vii] It would not surprise us if travel and leisure-related prices in the UK charted a similar course.
Cost increases related to supply chain issues and energy prices may linger for a while. Whilst basic economic theory holds that high prices encourage more production, and that more production eventually helps prices stabilise as supply and demand come back into balance, this process generally doesn’t happen overnight. In the energy realm, there are also unforeseeable wild cards, with one example being benchmark European natural gas prices surging yesterday after Germany announced it will suspend approval of the Nord Stream 2 pipeline that, if permitted, would increase gas flows from Russia to Continental Europe.[viii] Yet America’s industrial production data for October, released yesterday, offered some nuggets we found encouraging. One was the 9.3% m/m rise in oil and gas well drilling, which brought the cumulative increase from July 2020’s low to 93%.[ix] America is one of the world’s largest oil suppliers and increased production there should help prices stabilise globally.[x] To that end, the latest monthly report from the International Energy Agency showed global oil output rising by 1.4 million barrels per day (bpd) in October and projected a further 1.5 million bpd rise over the rest of this year—with continued increases in 2022.[xi] Time shall tell if this forecast proves correct, but in our view, the large jump in American drilling activity augurs well.
The other bits of good news from American industrial output were the 1.8% m/m rise in production of semiconductors and electronic equipment—which brought production of those components to a new all-time high—and the 17.8% rise in motor vehicle production.[xii] Whilst the latter has been quite choppy in recent months, October’s rise coincided with some encouraging comments from major global auto producers, two of which recently reported signs of the chip shortage beginning to ease.[xiii] Note, too, that semiconductor production earlier this year took temporary hits from the deep freeze in Texas over the winter, which affected chip foundries near Austin, and a fire at a large producer in Japan over the summer. Those temporary disruptions have now passed, which could very well point to the worst being behind us.
Whilst the future is unknowable, let us presume—for illustrative purposes—that the supply shortages and energy crunch ease soon, without monstrous price increases from here. What happens to the inflation rate? In our view, it would be unrealistic to expect prices to plummet, as in our experience that hasn’t held true. What usually happens, according to our research, is that after the economy swallows large one-off price increases—after they have finished working their way through the broad economy—then prices rise more slowly off a higher base. The UK actually lived through one of the clearest examples of this about a decade ago, when the standard value added tax (VAT) rate rose from 17.5% to 20.0% in January 2011. As Exhibit 1 shows, this immediately sent consumer prices higher, and the inflation rate remained elevated throughout 2011—even breaching 5% y/y at one point. But in 2012, the VAT increase moved from the numerator of the year-over-year calculation (current prices) to the denominator (prices one year ago). That is, they became part of the base, which helped the inflation rate slow. VAT didn’t fall—smaller price increases were simply compared to a higher base. The inflation rate would stay quite low for several years—and even turn negative at one point, due to a sharp fall in energy prices globally.
Exhibit 1: UK CPI Inflation and 2011’s VAT Rise
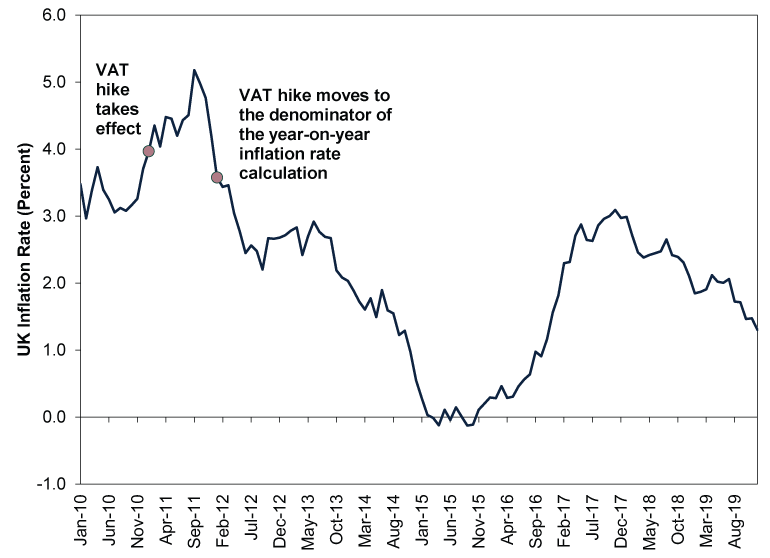
Source: FactSet, as of 17/11/2021. UK CPI Inflation Rate, January 2010 – December 2019.
In our view, this is the very definition of transitory inflation—large one-off price increases that eventually work their way through the economy. In our view, these eventually lose their bite as they exit the inflation calculation even if prices don’t fall, as the UK’s experience last decade demonstrates. VAT didn’t drop in 2012, and the standard rate remains at 20% today. But the economy adapted. Households dealt with higher costs and adjusted their budgets as needed. And, crucially, the UK’s economic output grew and its stock market delivered nicely positive returns over the decade.[xiv]
In our view, there are always small headwinds and cost pressures for businesses and households alike. Whilst they likely aren’t pleasant, our research shows they don’t automatically forestall economic growth or positive stock market returns. Rather, we think they help keep expectations low, raising the proverbial wall of worry that stock markets are often said to climb as reality goes better than investors broadly expect.
[i] Source: Office for National Statistics (ONS), as of 17/11/2021.
[ii] Source: FactSet, as of 17/11/2021.
[iii] Ibid.
[iv] Ibid.
[v] Ibid.
[vi] Ibid.
[vii] Ibid. Statement based on US Consumer Price Index inflation.
[viii] Ibid. Statement based on Dutch TTF Gas Prices.
[ix] Source: FactSet, as of 16/11/2021.
[x] Source: International Energy Agency, as of 16/11/2021.
[xi] “Oil Market Report – November 2021,” International Energy Agency, 16/11/2021.
[xii] See Note ix.
[xiii] Source: FactSet, as of 16/11/2021. Statement based on Q3 2021 earnings call transcripts from General Motors and Toyota. Please note that MarketMinder Europe does not make individual security recommendations and mentions individual companies to highlight a broader theme only.
[xiv] Source: FactSet, as of 17/11/2021. Statement based on UK gross domestic product (GDP) and MSCI UK Investible Market Index total returns. GDP is a government-produced measure of economic output.
Get a weekly roundup of our market insights.
Sign up for our weekly e-mail newsletter.

You Imagine Your Future. We Help You Get There.
Are you ready to start your journey to a better financial future?

Markets Are Always Changing—What Can You Do About It?
Get tips for enhancing your strategy, advice for buying and selling and see where we think the market is headed next.
Related Resources
-
Market Analysis Today in Brexit, Day 3,652: Brexit Turns 102026-06-24
-
Market Analysis Reviewing America’s Q1 Earnings and What Q2 Expectations Say2026-06-23
-
Politics Revolving Door Turns, Uncertainty Starts Falling2026-06-23
-
Macro Insights SpaceX IPO and Rising Equity Supply2026-06-23


Contact Us
Learn why 200,000 clients trust Fisher Investments and its affiliates to manage their money and find out how we may be able to help you achieve your financial goals.
As of 31/03/2026. Includes Fisher Investments and its affiliates.
New to Fisher? Call Us.
Contact Us Today