Personal Wealth Management / Market Analysis
Is Gold Signalling De-Dollarisation Looms? We Doubt It.
The US dollar is highly unlikely to lose its status as the world’s chief reserve currency, in our view, and even if it did, we don’t think it would decimate the global economy or markets.

In the 20th century, the US dollar gradually overtook the pound as the world’s main reserve currency. Lately, commentators we read say they see signs the dollar’s time is now up with more international trade being conducted in non-dollars, like the Chinese yuan and Indian rupee, and gold the apparent beneficiary. Many are citing a chart and argument making the rounds—and implying this is a potential destabilising force for the global economy. We think such theories are beyond a stretch, as we will show.
The chart in question supposedly shows a breakdown in the inverse relationship between America’s index-linked 10-year Treasury Inflation-Protected Securities (TIPS) yield and gold in USD—which some commentators we follow take as a sign the dollar is losing its reserve currency status. (Exhibit 1) Both theoretically attract money as inflation rises, presumably leading TIPS yields to fall (and prices to rise) as gold climbs—and vice versa when inflation fades. But over the last several months the link has allegedly weakened, with TIPS yields up almost three percentage points over the last year to levels last seen in 2010, whilst gold (in dollars)—though lower—remains near the high end of its range over this period.
Exhibit 1: Fun With Spurious Correlations, Part I
Source: FactSet, as of 4/4/2023. 10-year TIPS yield and gold price per troy ounce, 3/4/2007 – 3/4/2023. Presented in US dollars. Currency fluctuations between the dollar and pound may result in higher or lower investment returns.
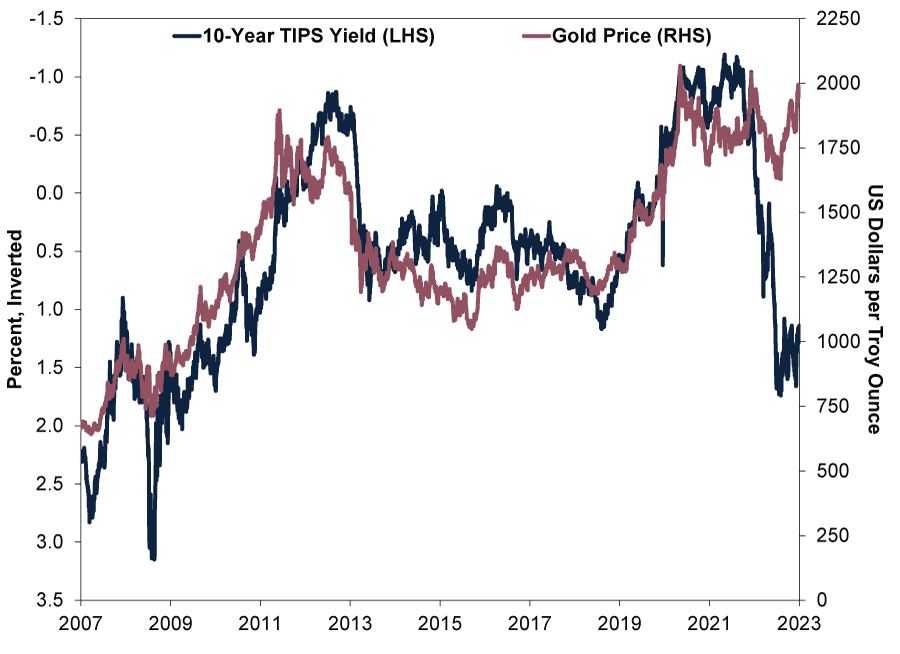
According to some analysts we follow, this alleged divergence suggests something is amiss. Many of them presume gold possesses intrinsic value globally—whilst TIPS pay only in dollars. They conclude: In an apparent time of trouble, the world’s preference for taking shelter in dollars has taken a hit. Coupled with Emerging Markets (EM) monetary policy institutions’ record gold buying—and some of the largest (e.g., Brazil, Russia, India, China and South Africa) reportedly forming their own reserve currency—commentators we follow jump to the conclusion the dollar is losing its lustre.[i]
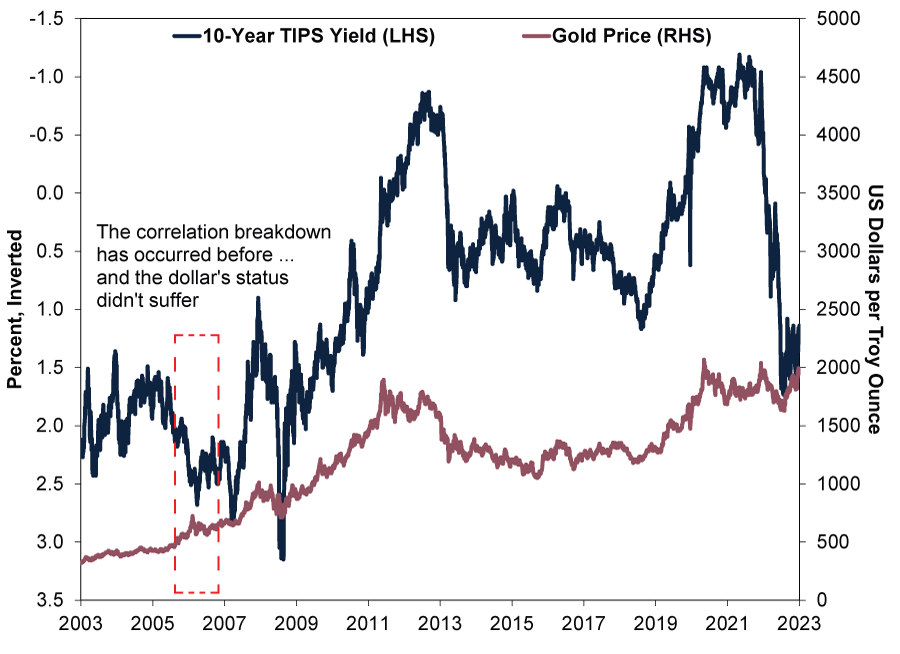
But not so fast. Zoom out a bit more and adjust the scales to reflect equivalent percentage point moves and the relationship isn’t as tight as initially portrayed. (Exhibit 2) For example, gold rallied from $411 per troy ounce in February 2005 to $725 in May 2006, whilst 10-year TIPS yield rose from 1.5% to 2.5%. The relationship’s actual breakdown then was more severe than today.
Exhibit 2: Fun With Spurious Correlations, Part II
Source: FactSet, as of 4/4/2023. 10-year TIPS yield and gold price per troy ounce, 3/4/2003 – 3/4/2023. Presented in US dollars. Currency fluctuations between the dollar and pound may result in higher or lower investment returns.
Whilst that is just one extreme example of divergence, in our view, the historical relationship actually isn’t very consistent. Consider: We calculated the monthly correlation between the change in TIPS yields (percentage points) and the percentage change in dollar-denominated gold prices over the last 20 years. Correlation is a statistical measurement of the directional relationship between two variables. A correlation of 1.0 means the assets move in lockstep, and -1.0 means they are polar opposites. For the theory to hold, the two should usually be strongly negatively correlated—with today showing the opposite.
That isn’t the case, though. We find the correlation over the last 20 years is -0.45, showing a rather weak relationship between the two.[ii] Over the 12 months ended in March, it is similarly weak, at -0.46.[iii] Exhibit 1, which purportedly shows a break from the norm, glosses over the actual directional volatility. In short, our analysis shows the relationship isn’t set in stone, past breaks haven’t hinted at dollar doom and we see little sign the present one, to the limited extent it even exists, does either.
Beyond this, some commentators we follow argue EM monetary policy institutions have been buying lots of gold lately, suggesting a shift in preference from the dollar to a shiny yellow metal. But that preference isn’t necessarily portentous. Our research finds monetary policy institutions don’t have a terribly great record of timing gold purchases, which no knock on them, few do. In the decade to 2010, for example, they were net sellers when gold in USD tripled.[iv] Whilst they have been net buyers since 2010, gold has mostly moved sideways.[v] We don’t think their buying signals anything about gold’s—or the dollar’s—longer-term direction. Meanwhile, their latest bout of buying just reverses a long-running trend away from gold, to only 7% of EM reserves in 2021 down from 30% in 1950.[vi] Developed markets’ gold reserve share shrank to 17% in 2021 from 80% in 1950.[vii]
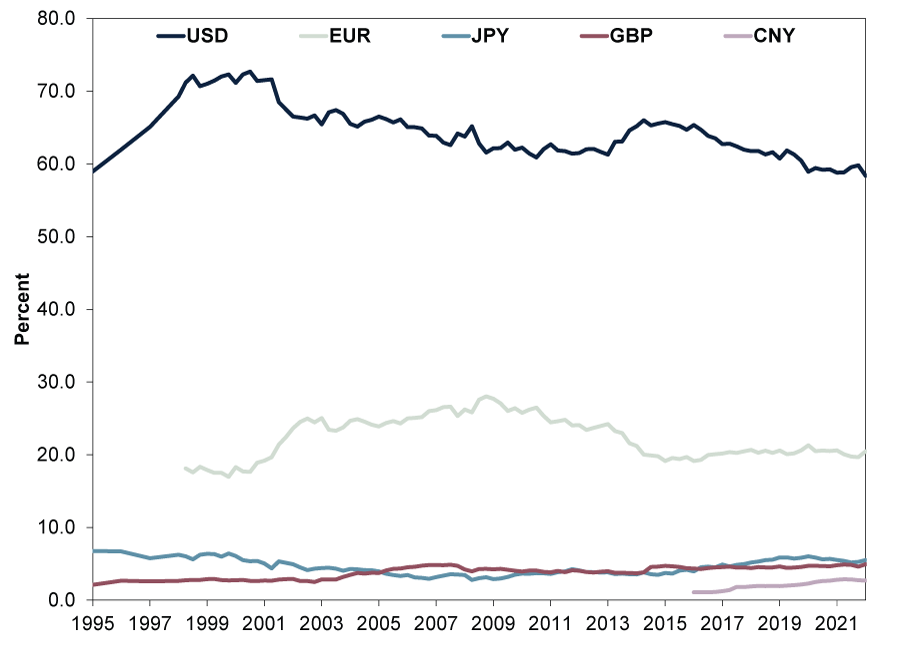
Whilst chatter abounds about the dollar losing its status amongst commentators we follow, actual dollar-use data show it is still very much in demand and widely held. Though we haven’t found a great way to track how much world trade uses dollars, the Bank for International Settlements (BIS) estimates about half of trade globally is invoiced in dollars, despite America accounting for only around 10% of global trade.[viii] We think another way to see this is to use the dollar’s share of global currency reserves as a proxy for demand. The International Monetary Fund’s (IMF’s) Currency Composition of Official Foreign Exchange Reserve data aren’t perfect, in our view, but the dollar’s share was 55.5% in Q3 2022 versus about 70% two decades ago. (Exhibit 3) Down, yes, but no one else comes close.[ix] Besides, the total amount of reserves is up a lot, so there are actually more dollars held in reserve than two decades ago, despite its falling share.[x]
Exhibit 3: USD Still Dominates as Global Reserve Currency
Source: IMF, as of 4/4/2023. Percent of allocated reserves in US dollars, euros, Japanese yen, British pounds and Chinese yuan, 1995 – 2022.
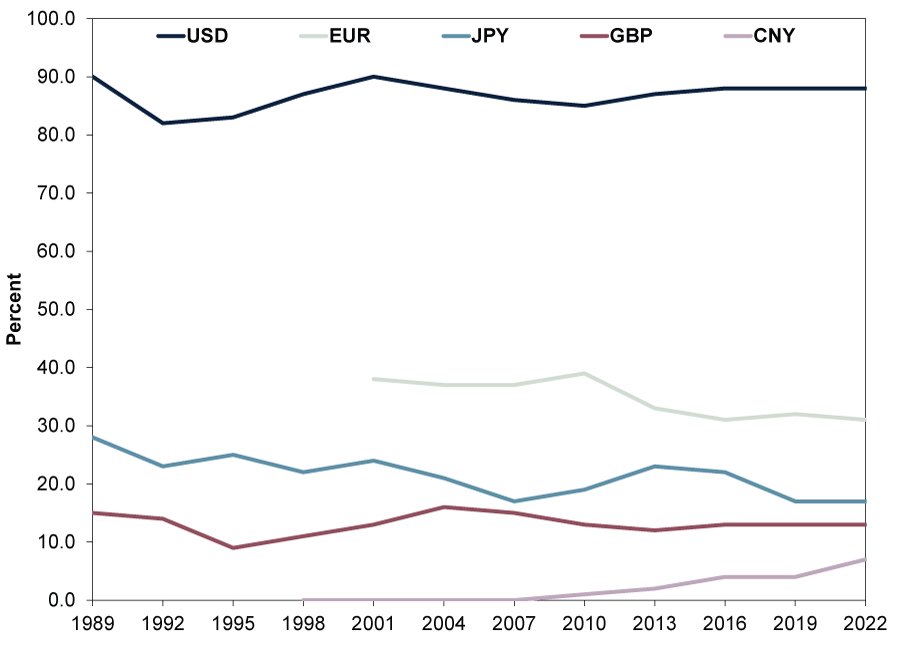
Then too, in global finance, 88% of foreign exchange transactions (out of 200% given pairwise trading) use the dollar. (Exhibit 4) As the BIS states, it also dominates offshore funding markets: “As of the second quarter of 2022, the amount of debt and loans denominated in USD where neither the issuer/borrower nor the lender is a US resident is estimated to be 88% of total international USD-denominated debt and 65% of total international USD bank loans.”[xi]
Exhibit 4: USD Still Dominates in Global Currency Trading
Source: BIS, as of 4/4/2023. Percent of global currency trading for US dollars, euros, Japanese yen, British pounds and Chinese yuan, 1989 – 2022. Note: Currency trading shares sum to 200% because currencies always trade in pairs.
Now, these dollar usage stats are all backward looking. They could change. But we think the chances that happens fast are exceedingly low. And even if the dollar’s reserve currency and trade status did dwindle, it probably wouldn’t be disastrous for the US and global economies, in our view. Whilst the Suez Crisis was a rough patch in British history, the UK economy continued growing after the dollar overtook the pound as coin of the realm in the mid-20th century.[xii] Gilt yields are about the same as Treasurys’ today.[xiii] If exorbitant privilege doesn’t confer any advantage, we doubt losing it would be a disadvantage, much less ruinous for America and the world overall.
We find the dollar is convenient because of the US’s big economy—which produces goods and services consumed globally—with deep, liquid and open financial markets facilitating that trade. That is why we think dollars remain in demand. Those factors don’t look to us like they will change any time soon.
[i] “Central Banks Bought the Most Gold on Record Last Year, WGC Says,” Staff, Reuters, 8/2/2023. Accessed via the Internet Archive.
[ii] Source: FactSet, as of 4/4/2023. Monthly correlation in percentage change of gold price and percentage point change in 10-year Constant Maturity TIPS Yield, March 2003 – March 2023.
[iii] Ibid.
[iv] Source: FactSet, as of 4/4/2023. Statement based on gold price per troy ounce in USD, 31/12/1999 – 31/12/2009 and 31/12/2009 – 3/4/2023. See note i.
[v] Ibid.
[vi] “Gold as International Reserves: A Barbarous Relic No More?” Serkan Arslanalp, Barry Eichengreen and Chima Simpson-Bell, IMF Working Paper, January 2023.
[vii] Ibid.
[viii] “Revisiting the International Role of the US Dollar,” Bafundi Maronoti, BIS Quarterly Review, 5/12/2022.
[ix] Source: IMF, as of 4/4/2023.
[x] Ibid.
[xi] See note viii.
[xii] Source: Economic Statistics Centre of Excellence, as of 4/4/2023. Statement based on Historical Data UK National Accounts, 1700 – 2016.
[xiii] Source: FactSet, as of 4/4/2023. 10-year Treasury and Gilt yields, 3/4/2023.
Get a weekly roundup of our market insights.
Sign up for our weekly e-mail newsletter.

See Our Investment Guides
The world of investing can seem like a giant maze. Fisher Investments UK has developed several informational and educational guides tackling a variety of investing topics.
Related Resources
-
In The News Fisher Investments UK Reviews the Limits of Long-Term Forecasts2025-09-02
-
Market Analysis A Market Lesson From Germany’s Economic Data Revision2025-08-26
-
Economics Global Manufacturing Green Shoots?2025-08-25
-
Economics Global Economic Roundup2025-08-22


Contact Us
Learn why 185,000 clients* trust Fisher Investments and its affiliates to manage their money and may be able to help you achieve your financial goals.
*As of 30/06/2025
New to Fisher? Call Us.
Contact Us Today