Personal Wealth Management / Economics
Auto Loans Aren’t Likely to Tank America’s Economy
Put rising US delinquency rates in perspective.
Do America’s rising auto loan delinquency rates make consumer debt trouble automatic, with potential global reverberations? Commentators we follow suggest they are an early tell an economic wreck awaits. However, we think putting the data in proper context shows why consumer debt isn’t about to make the US economy’s engines sputter out—making this a brick in global stocks’ proverbial wall of worry, in our view. Take a look under the bonnet with us!
Those commentators seeing a looming credit crisis say the recent uptick in auto loan delinquencies is a sign of strapped American households—a canary in the coal mine for other consumer debt like credit cards and mortgages. We find this stems from long-running concerns that auto lending has become the new subprime (a category of borrowers with poor credit history) mortgage—echoing the mid-2000s’ boom in loans to US homebuyers with questionable creditworthiness, on which most coverage we read pins the global financial crisis in 2007 – 2009.[i] The alleged data signalling credit chickens coming home to roost: Used automobile trade-ins show a rising trend in negative equity—where the amount of debt left on a car exceeds its value.[ii] Because of the combination of sky-high car prices’ cooling and rising auto loan rates, more people are underwater on their cars.[iii] Buyers have taken out bigger loans to finance their vehicle purchases—sometimes stretching them out to seven years, versus an average of six—but with used car prices now sliding, they increasingly owe more than their car is worth.[iv]
Delinquency rates on these loans are now rising.[v] Cox Automotive reports loans 60+ days past due were up 20.4% y/y in January to 1.89% of all auto loans, the highest rate since 2006.[vi] Some reports we see argue this indicates outsized car payments are more unaffordable, competing with other household demands—e.g., food eating into budgets—and higher delinquency rates are evidence the strain is showing.[vii]
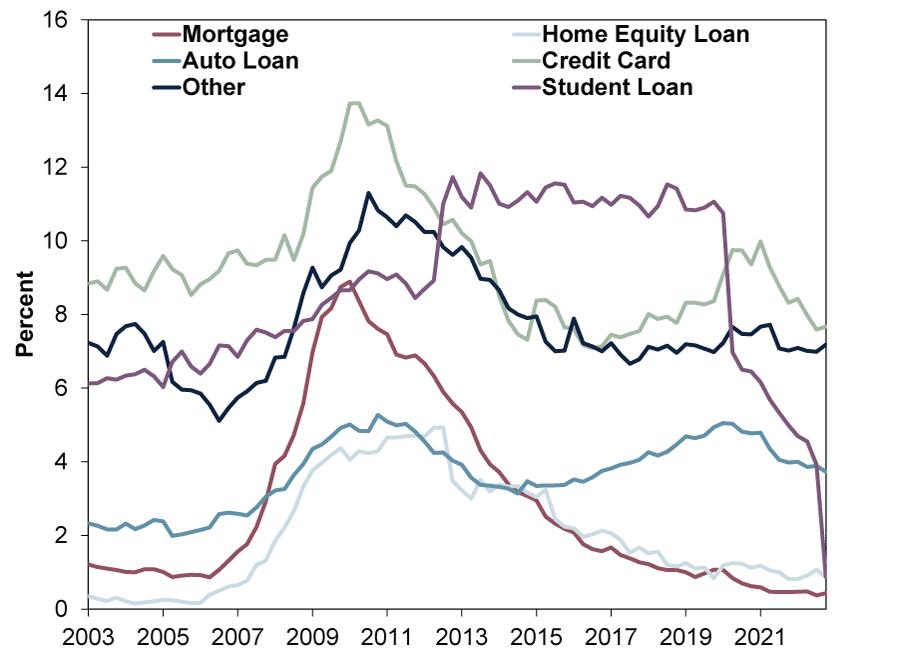
We don’t dispute some American households have been hit hard. But for broader perspective, the US Federal Reserve (Fed) Bank of New York branch helpfully lays out households’ aggregate debt and delinquency rates. Exhibit 1 shows auto loans (medium blue) comprise 9% of total US household debt. But whilst balances have risen 16.6% from pre-pandemic levels, Exhibit 2 shows seriously delinquent rates—90+ days past due, using the New York Fed branch’s definition—have fallen to 3.7% through Q4 2022 from 5.0% in Q4 2019—and its 5.3% peak in Q4 2010 coming out of 2007 – 2009’s recession (broad decline in economic activity). Maybe delinquency rates will indeed move higher in coming quarters. But a return to pre-pandemic rates would be normal, not alarming, in our view.
Exhibit 1: Auto Loans Are 9% of Total US Household Debt
Source: US Federal Reserve Bank of New York, as of 3/3/2023. Quarterly Report on Household Debt and Credit: Total Debt Balance and its Composition, Q1 2003 – Q4 2022.
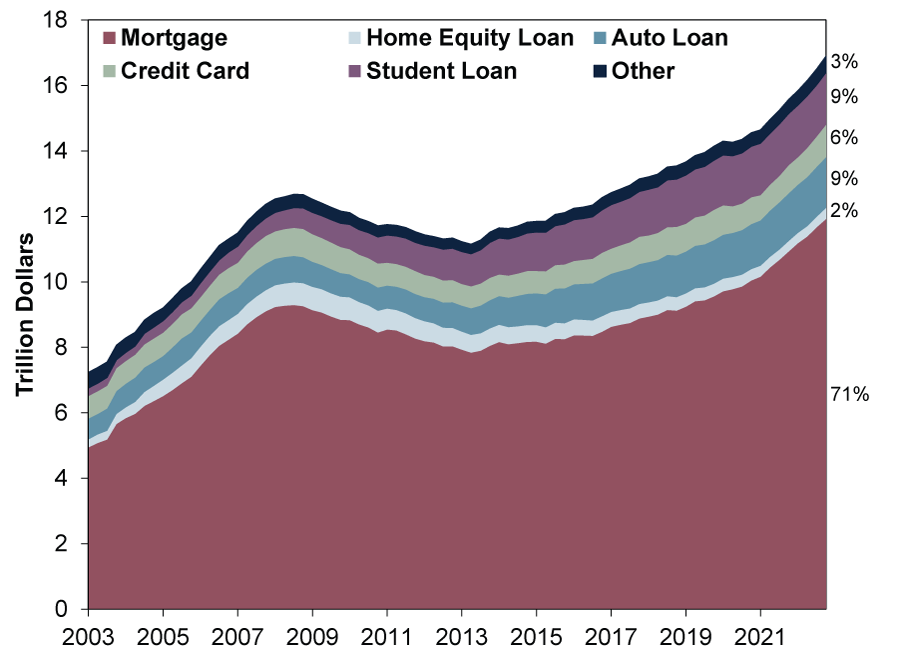
Exhibit 2: US Households’ Delinquency Rates by Type
Source: US Federal Reserve Bank of New York, as of 3/3/2023. Quarterly Report on Household Debt and Credit: Percent of Balance 90+ Days Delinquent by Loan Type, Q1 2003 – Q4 2022.
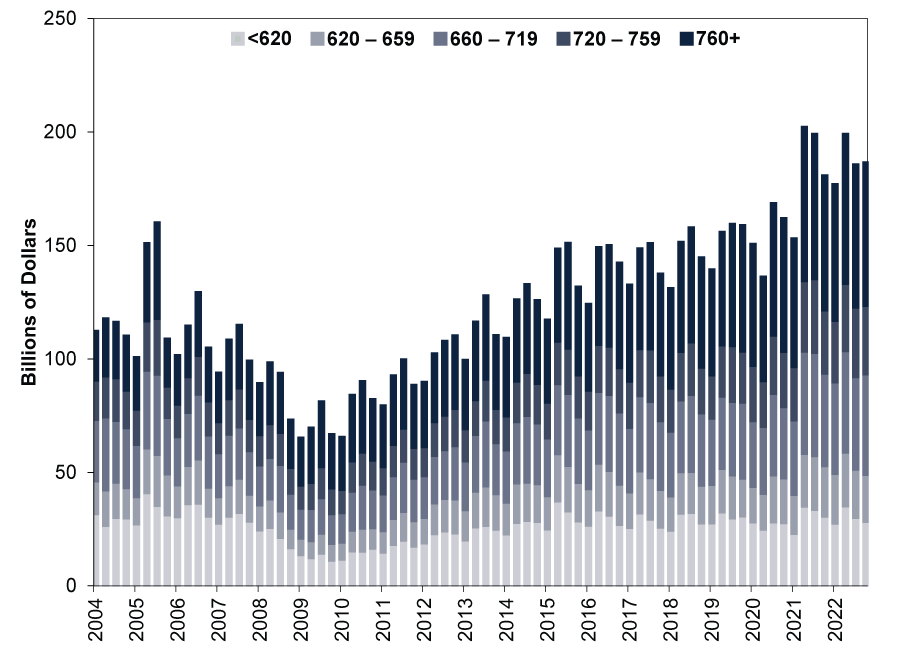
That said, we don’t think escalating delinquencies—from low levels—is guaranteed. Cox Automotive’s data show credit standards have tightened. American subprime car buyers accounted for just 5.2% of sales in December, compared to 13.9% in 2017.[viii] They are a dwindling share of overall auto loans. The New York Fed branch’s data echo this. Exhibit 3 shows relatively stricter underwriting standards over the years, as those with lower scores hold fairly constant, whilst higher-rated borrowers increase. Although credit scores aren’t perfect, to the degree they broadly reflect borrowers’ ability to service debt, the lion’s share of US auto loans taken out the last couple years are from creditworthy buyers.
Exhibit 3: US Auto Loan Originations by Credit Score
Source: US Federal Reserve Bank of New York, as of 3/3/2023. Auto loan originations by credit score, Q1 2004 – Q4 2022.
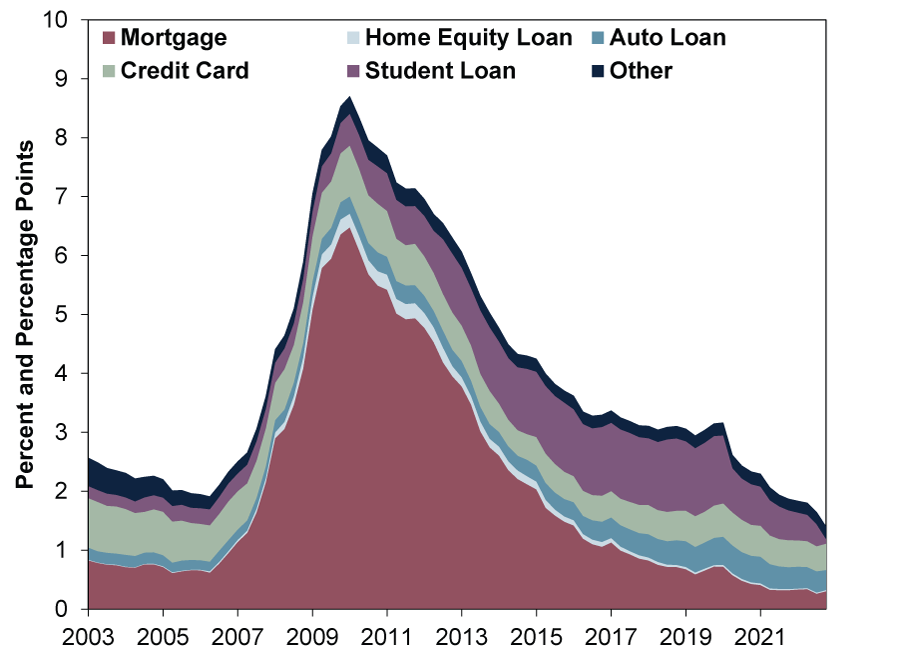
Put together and considered as a whole, Exhibit 4 shows total household delinquency rates hit at least a two-decade low last quarter (granted, this was due partly to the presidential administration’s ongoing moratorium on student loan payments). Overall default rates remain historically low, too. The monthly S&P/Experian Consumer Credit Default Composite Index, which combines US auto loans’, mortgages’ and credit cards’ default rates, has crept up to 0.69% in January from November 2021’s 0.37% record low.[ix] Yet it is still below any point pre-pandemic—1.02% in February 2020—and a far cry from its 1.72% peak in December 2012.
Exhibit 4: US Households’ Delinquency Rate and Its Composition
Source: US Federal Reserve Bank of New York, as of 3/3/2023. Quarterly Report on Household Debt and Credit: Percent of Balance 90+ Days Delinquent by Loan Type, Q1 2003 – Q4 2022.
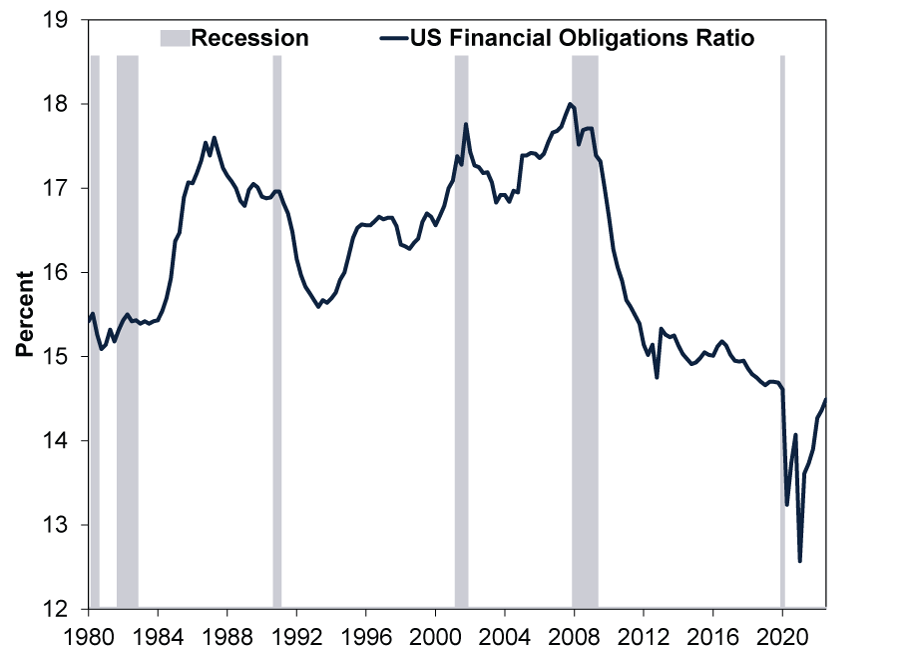
Now, low delinquency and default rates by themselves don’t automatically mean smooth sailing ahead, in our view. So consider US household finances—overall and on average—today. Exhibit 5 shows Americans’ debt service, including other financial obligations (rent, property tax and homeowners’ insurance), as a percentage of disposable personal income was only 14.5% in Q3 last year—also below any point pre-pandemic. With US households’ incomes more than covering their financial obligations by a historically high degree, on average, we don’t think it is a coincidence delinquency and default rates remain low. Hence the warnings that Americans’ debt burdens aren’t sustainable and their interest costs will run out of control are out of touch with reality, in our view.
Exhibit 5: US Households’ Financial Load Historically Light
Source: US Federal Reserve, as of 3/3/2023. Financial Obligations Ratio, Q1 1980 – Q3 2022.
[i] We agree subprime was part of the back story, but we don’t think it would have spiralled the way it did had the US’s mark-to-market accounting rule (FAS 157) not forced banks to mark illiquid and hard-to-value assets that they never intended to sell to the latest comparable sale price. This, according to the research of former FDIC head William Isaac, is what caused about $200 (£169) billion in loan losses to spiral into about $2 (£1.69) trillion in exaggerated and unnecessary reductions of these assets’ values on bank balance sheets—which we think in turn triggered the illiquidity that brought down several major financial institutions. More information on this is available in Mr. Isaac’s book, Senseless Panic (Wiley, 2012).
[ii] “Car Debt Is Piling Up as More Americans Owe Thousands More Than Vehicles Are Worth,” Paige Smith and Michael Sasso, Bloomberg, 1/3/2023. Accessed via Yahoo!
[iii] Ibid.
[iv] Ibid. “How Long Should a Car Loan Be?” Ronald Montoya, Edmunds, 1/4/2022.
[v] “Auto Market Weekly Summary: February 13,” Jonathan Smoke, Cox Automotive, 13/2/2023.
[vi] Ibid.
[vii] “On the Heels of the Pandemic, Borrowers With Low Credit Are Falling Behind on Car Loans,” Bailey Schulz, USA Today, 7/3/2023.
[viii] “Seismic Shift: The US New-Vehicle Market is Becoming a Luxury Market,” Staff, Cox Automotive, 23/2/2023.
[ix] Source: S&P Global, as of 3/3/2023.
Get a weekly roundup of our market insights.
Sign up for our weekly e-mail newsletter.

You Imagine Your Future. We Help You Get There.
Are you ready to start your journey to a better financial future?

Markets Are Always Changing—What Can You Do About It?
Get tips for enhancing your strategy, advice for buying and selling and see where we think the market is headed next.
Related Resources
-
Macro Insights Brazil Review & Outlook2026-06-04
-
Market Analysis Global Bond Calamity Calls for Calm Perspective2026-05-27
-
Economics A May Global Economic Check-In2026-05-26
-
Macro Insights Macro Insights Q2 20262026-05-22


Contact Us
Learn why 200,000 clients trust Fisher Investments and its affiliates to manage their money and find out how we may be able to help you achieve your financial goals.
As of 31/03/2026. Includes Fisher Investments and its affiliates.
New to Fisher? Call Us.
Contact Us Today