Personal Wealth Management / Market Analysis
A Closer Look at Rate Hike Cycles and Stocks
Our research shows stock returns are usually positive during periods when monetary policy institutions are raising rates.
Recent Bank of England (BoE) and US Federal Reserve (Fed) rate hikes have many commentators we follow questioning the outlook for stocks. The BoE warned further hikes are likely given its forecast for higher inflation, even as UK economic growth seems set to slow.[i] After the Fed’s first step up from zero last month, its graph of Federal Open Market Committee (FOMC) members’ fed-funds target rate projections implied more rate hikes at every meeting this year.[ii] If so, this would mean six more quarter-point increases, potentially putting the benchmark rate’s range at 1.75 – 2% by yearend. There is a lot of chatter amongst commentators we follow about what monetary policy institutions’ rate hikes might do to global stocks, but our research shows markets are often resilient as alleged tightening cycles get going.
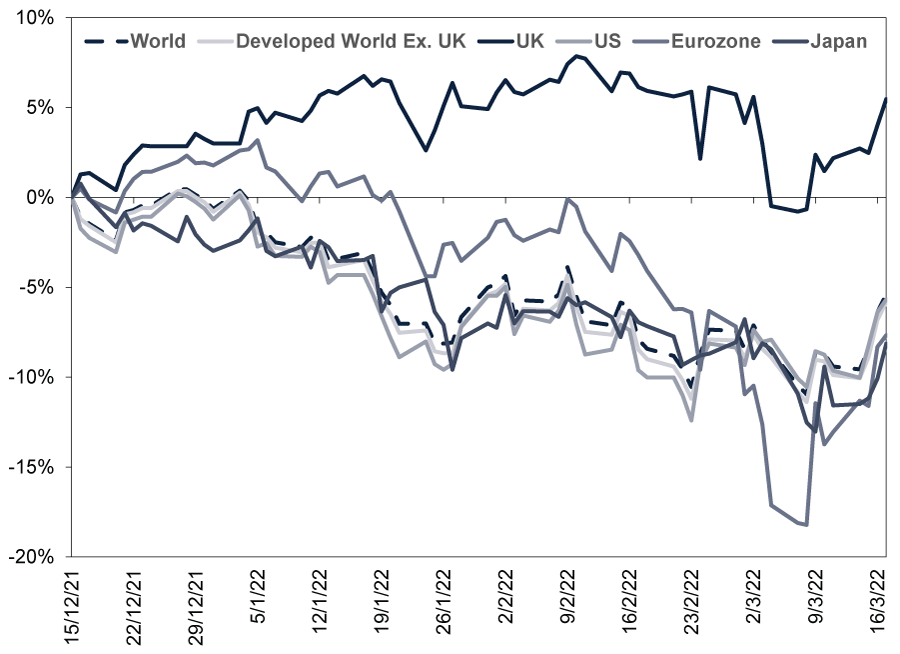
Whilst this rate hike cycle is young, we see some preliminary evidence that successive rate hikes aren’t bad for stocks. The BoE hiked its Bank Rate for the third straight time last Thursday. It is now back to pre-COVID levels. How have UK stocks fared during the BoE’s tightening so far? Since 16 December, when the bank first hiked from 0.1% to 0.25%, to 17 March’s move to 0.75%, the MSCI UK Index is up 5.5%.[iii] That is rather remarkable, in our view, as the UK has handily outperformed relative to the rest of the world. The MSCI World Index fell -5.4% over the same stretch. (Exhibit 1) Now, we think UK markets’ oil-and-commodities tilt probably explains some of this outperformance.[iv] Regardless, though, we think this shows that even a pretty aggressive start to tightening isn’t automatically bearish.
Exhibit 1: BoE Rate Hikes Don’t Appear to Have Stymied UK Markets
Source: FactSet, as of 21/3/2022. MSCI World, World excluding UK, EMU, Japan and S&P 500 returns with net dividends and MSCI UK total return, 15/12/2021 – 17/3/2022.
Based on our historical analysis, using America’s S&P 500 for its longer history and the US’s nearly two-thirds global stock market weighting, stocks have done better than commentators we follow suggest through rate hike cycles.[v] As Exhibit 2 shows, cumulative S&P 500 returns were positive in 8 of the last 9, with an average annualised total return in USD of 11.8% and a median of 7.5%. Past performance isn’t predictive, of course. But as a guide, we think history suggests stocks can hold up for sizable chunks of Fed tightening stretches.
Exhibit 2: Stocks Mostly Rise During Rate Hike Cycles
Source: Federal Reserve Bank of St. Louis, Global Financial Data, Inc., and FactSet, as of 21/3/2022. Federal-funds rate target, July 1971 – December 2008, federal-funds rate target upper limit, December 2008 – February 2022, and S&P 500 total returns, presented in US dollars, July 1971 – December 2018. Note: The Fed hiked in December 1986, but it was a brief cycle. The S&P 500’s forward 12-month total return was 5.2%. *Percentage Point. Presented in US dollars. Currency fluctuations between the dollar and pound may result in higher or lower investment returns.
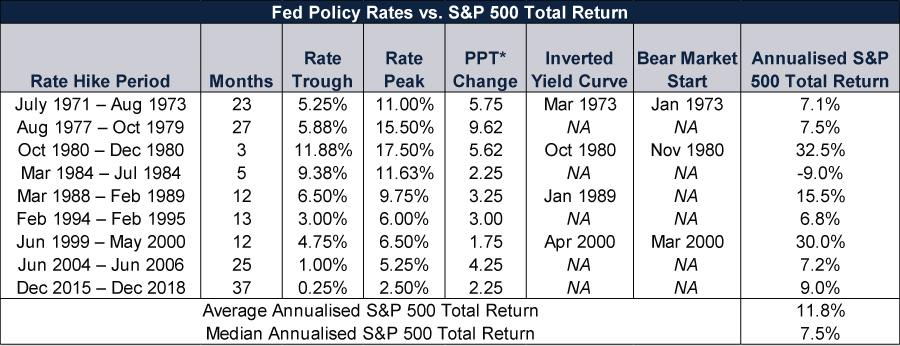
Now, as the table shows, some bear markets (typically prolonged, fundamentally driven declines exceeding -20%) began during these rate hike periods: in January 1973, November 1980 and March 2000. But all occurred amidst Fed rate hikes that caused yield curve inversions, when short-term policy rates topped 10-year US Treasury yields. (A yield curve plots an issuers’ interest rates across a given range of maturities.) On most occasions, the bear market didn’t begin for several months or more after the initial hike. In other words, we wouldn’t consider rate hikes by themselves as problematic for markets. Their impact on the yield curve is the swing factor, in our view.
More generally, we wouldn’t take the Fed’s—nor any other monetary policy institution’s—rate hike projections as gospel. It is possible the fed-funds range’s upper edge hits 2% by yearend—and 2.75% in 2023.[vi] Additionally, accompanying the tightening that suggests, there has been an uptick in concern amongst commentators we follow that if the Fed follows this path, it could err and invert the yield curve, since 10-year Treasury rates are currently around 2.4%.[vii] A deep and prolonged inversion could tighten financial conditions enough to cause a recession (a broad-based decline in economic activity), especially if global yield curves follow suit, in our view. Although we think this is something to watch out for, we also think it is far too premature to worry about it now.
First, monetary authorities’ decisions aren’t predictable, in our view. As we have written before, we don’t think their interest rate forecasts are anything to go by. To us, they demonstrate monetary officials’ opinion of where interest rates are likely to be if economic data evolve as they expect—not policy commitments or blueprints. In our experience, reality often defies rate forecasts.
Second, we think the monetary authorities’ power is overrated. A series of rate hikes (or cuts) in aggregate may affect borrowing, depending on what long rates do, but we think the monetary policy institutions are more rate followers than a rate setters. According to our research, they normally move after the fact to where short-term rates already are—they are stragglers, not a trailblazers. If financial conditions are tightening, market-set rates will likely show it before monetary policy institutions confirm them, in our view.
Third, for markets, we don’t think monetary policymakers’ decisions have any pre-set outcomes. Our research shows rate hikes aren’t inherently negative for stocks, and cuts aren’t necessarily positive, either (or vice versa). We think this is because markets incorporate expected moves into prices in advance. In our view, if monetary policymakers do what everyone already thinks is likely, there isn’t much reason to believe any action should drive stocks further beyond random short-term sentiment swings.
As for the yield curve, long-term interest rates aren’t static.[viii] In the two weeks since the BoE’s last move, 10-year gilt yields have climbed from 1.5% to 1.7%.[ix] We don’t think anyone should read too much into short-term moves, but further BoE or Fed hikes causing an inversion in the near term isn’t a given. In the meantime, when waiting for future monetary policy actions, take solace: History—and the present wall of worry, which includes tightening chatter—point to more bull market ahead.
[i] “Bank of England Hikes Rates Again, Adopts Dovish Tone as Ukraine War Adds to Inflation Concerns,” Elliot Smith, CNBC, 17/3/2022.
[ii] Source: US Federal Reserve, as of 16/3/2022. Summary of Economic Projections, 16/3/2022.
[iii] Source: FactSet, as of 24/3/2022. MSCI UK total return, 16/12/2021 – 17/3/2022.
[iv] Source: FactSet, as of 1/4/2022. Statement based on MSCI UK IMI sector weights.
[v] Ibid. Statement based on US market capitalisation weight in MSCI World Index, 3/23/2022.
[vi] See notes ii and iii.
[vii] Source: FactSet, as of 1/4/2022. 10-year US Treasury yield, 1/4/2022.
[viii] Source: Federal Reserve Bank of St. Louis, as of 24/3/2022. 10-year Treasury yield, 2/1/1962 – 23/3/2022.
[ix] Source: FactSet, as of 1/4/2022. 10-year gilt yield, 17/3/2022 – 1/4/2022.
Get a weekly roundup of our market insights.
Sign up for our weekly e-mail newsletter.

You Imagine Your Future. We Help You Get There.
Are you ready to start your journey to a better financial future?

Markets Are Always Changing—What Can You Do About It?
Get tips for enhancing your strategy, advice for buying and selling and see where we think the market is headed next.
Related Resources
-
In The News Predictions of an AI dystopia are the height of arrogance2026-03-23
-
Politics Beyond the War: A Political Roundup Covering America, Canada and Denmark2026-03-18
-
Economics Doubts Aplenty After UK January GDP Flatlined2026-03-18
-
Environmental, Social and Governance Insights Responsible Investment Newsletter 20262026-03-11


Contact Us
Learn why 195,000 clients trust Fisher Investments and its affiliates to manage their money and find out how we may be able to help you achieve your financial goals.
As of 31/12/2025. Includes Fisher Investments and its affiliates.
New to Fisher? Call Us.
Contact Us Today