Personal Wealth Management / Market Analysis
A Mid-September Economic Roundup
As we enter autumn, here is an end-of-summer economic data roundup.
Based on our review of the latest sentiment surveys, many people are feeling dour both here and globally. Considering financial publications we monitor have continually warned about economic developments ranging from rising prices to monetary policy institutions’ actions, we think the bleakness is understandable. Along with the discussion about today’s prospects, we have observed economists argue more challenges loom ahead, including the prospect of a global recession (a prolonged economic downturn). That is possible. But a roundup of the latest data out of the world’s largest economies continue showing a mixed picture, in our view—and for investors, that is worth keeping in mind when comparing reality to such dark expectations and sentiment.
Reviewing the Latest Out of China
China’s National Bureau of Statistics released several data series for August last Friday, and they beat analysts’ expectations tallied by data provider FactSet. Industrial production rose 4.2% y/y, ahead of expectations of 3.9%, whilst retail sales were up 5.4%, 2 percentage points better than consensus estimates.[i] Fixed asset investment (things like infrastructure projects), grew 5.8% on a year-to-date, year-over-year basis—which the National Bureau of Statistics produces to eliminate skew caused by shifting holidays like the Lunar New Year—which was also a few ticks higher than expectations of 5.5%.[ii]
Now, August’s stronger-than-projected figures may not imply broad-based economic strength, as we think reality is more nuanced. For example, retail sales’ growth, the quickest in six months, was partially tied to a mathematical phenomenon known as the base effect. Year-over-year calculations compare the percentage change between sales in one month and the same month a year prior. A lower denominator can result in a larger quotient (and vice versa). In this case, the Delta COVID wave weighed on August 2021 economic activity, depressing the denominator for the year-over-year comparison this year. Separately, China’s heatwave led to a spike in electricity production, which boosted industrial production.[iii] The auto industry contributed positively to both measures, too: Subsidies for electric vehicles buoyed car sales, and heightened demand led to a surge in output of new electric vehicles.[iv] As for fixed-asset investment, we saw some analysts credit the pickup to government stimulus efforts (e.g., extensions of credit to infrastructure spending) bearing some fruit.
Interestingly, most coverage we read highlighted these sensible caveats to the data—yet also argued headwinds tied to the government’s zero-COVID policy and ongoing property weakness implied the economy was weaker than appreciated. In our view, this is yet another example of the pessimism of disbelief at work—a psychological phenomenon in which investors emphasise bad news and look for negatives in news that would otherwise look good. To be clear, we aren’t dismissing China’s economic soft spots. Our research shows zero-COVID policy in particular weighs on both domestic and external demand, and we think Chinese economic growth will probably be slower than in past years regardless of the government’s actions.
But our analysis of market history finds slow economic growth doesn’t hinder stocks. Whilst we have seen many arguments based on the premise that fast Chinese growth is a needed engine for the global economy, we think this is both overstated and unrealistic. China is the world’s second-largest economy, which means it is expanding from a huge base.[v] Based on our study of economic history, expectations for GDP (gross domestic product, a government-produced measure of economic output) growth at high-single or even double-digit rates into perpetuity aren’t reasonable. Besides, even at slower growth rates, China is still adding a lot to global economic activity that we think is already better than so many appreciate.
US Industry Is a Mixed Bag
Along with retail sales, US industrial production (IP) hit newswires last week. August’s reading dipped -0.2% m/m, as a weather-related slump weighed on the Utilities industry (-2.3% m/m), though we have seen some analysts suggest a big September rebound is coming tied to America’s continental west coast’s recent hot spell.[vi] Positively, manufacturing—the largest industry group and representative of about 12% of US GDP—ticked up 0.1%, its second-straight positive month.[vii] Another notable development: Oil & gas drilling rose 2.7%, its 11th straight monthly rise and a sign, in our view, of market forces at work. Consider: High energy costs, including petrol and natural gas (tied to strong air conditioning demand), have dominated headlines and weighed on many consumers’ moods this year, according to many sentiment surveys we cover.[viii] Yet ongoing production in the US oil & gas industry suggests producers are responding to price signals and bringing on supply to meet demand—which argues against perpetually rising prices, in our view.
Overall, August IP was a mixed bag, as production rose in machinery, aerospace equipment, and computers and electronics but fell in autos and consumer goods.[ix] The picture was similarly muddled at a regional level. The New York Federal Reserve’s Empire State purchasing managers’ index registered a -1.5 reading in September—contractionary, but a big improvement from August’s -31.3—as respondents reported higher new orders and a deceleration in price increases.[x] However, the Philadelphia Federal Reserve’s regional manufacturing survey worsened from 6.2 in August to -9.9 in September, its third negative reading in the past four months.[xi] Respondents here also reported decelerating prices—though new orders worsened—and September’s reading reverses August’s pattern, showing no clear trend.[xii] Whilst the lack of clarity can be frustrating, we think these manufacturing readings are a microcosm of the mixed economic data in both the US and abroad recently.
On the UK’s (Unsurprisingly) Poor Retail Sales Report
UK August retail sales fell -1.6% m/m, continuing a downward trend since last summer, as all major sectors contracted.[xiii] Moreover, this is on a volume—inflation-adjusted—basis, so we think the contraction suggests high prices are weighing on consumer spending to an extent. Households are saying as much, too. Per an Office for National Statistics survey conducted from 31 August – 11 September, about 87% of adults reported a higher cost of living over the past month, a jump from 62% in November 2021 (when the survey question was first asked).[xiv] Unsurprisingly, about half of respondents noted difficulty in paying their energy bills.[xv]
This isn’t positive, of course, as more households face hardships due to rising prices. But for stocks, this trend isn’t new, as retail sales values and volumes have been diverging since early 2021. (Exhibit 1)
Exhibit 1: Divergence in UK Retail Sales’ Values and Volumes
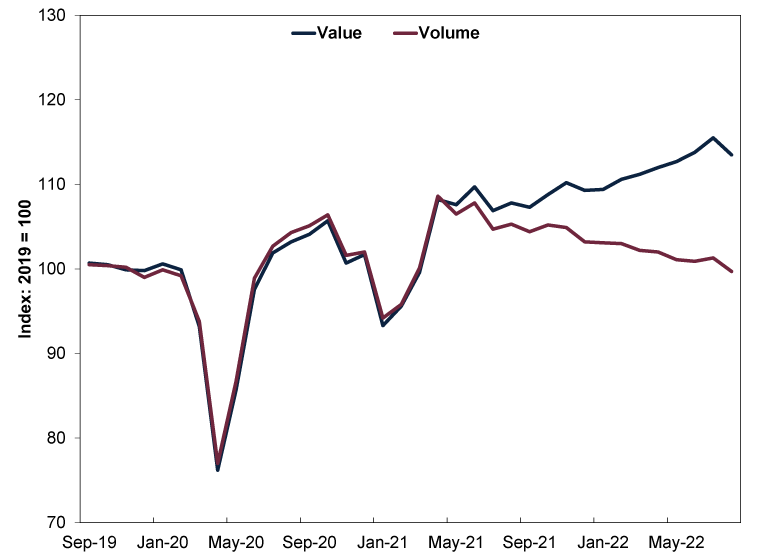
Source: Office for National Statistics, as of 19/9/2022.
Whilst we don’t dismiss the negative impact on retail businesses, stocks don’t need strong growth to climb. Based on our studies of capital markets, stocks don’t view news in the traditional good or bad sense as most people understand it. Rather, they are callous—and ruthlessly efficient—discounters of widely known information, focussed most on the economic and political factors that impact corporate profits over the next 3 – 30 months. In our view, they are likely not surprised by weak UK retail results.
Moreover, considering how low expectations are in the UK—we have seen many economists make recession forecasts—we think tepid-but-still-positive data have the ability to surprise to the upside. Another potential sentiment fillip: Chancellor Kwasi Kwarteng is planning to announce a small relief package this week. Whilst we don’t think government spending is necessary or even all that effective in boosting the UK’s private sector-dominant economy, the news could help investors feel like the issue has been addressed, allowing them to start moving on.
[i] Source: FactSet, as of 16/9/2022.
[ii] Ibid.
[iii] “China's Economy Perks Up but Dogged by Property Crisis,” Kevin Yao and Ellen Zhang, Reuters, 15/9/2022. Accessed via Yahoo! News.
[iv] Ibid.
[v] Source: The World Bank, as of 21/9/2022. Statement based on China’s 2021 GDP in constant 2015 USD.
[vi] Source: FactSet, as of 19/9/2022.
[vii] Source: FactSet and Bureau of Economic Analysis, as of 19/9/2022. Statement based on manufacturing’s value added by industry as a percentage of gross domestic product for Q1 2022.
[viii] “US Natural Gas Prices Spike to 14-Year High. Here's Why,” Matt Egan, CNN Business, 17/8/2022.
[ix] See note vi.
[x] “Empire State Manufacturing Survey, September 2022,” Federal Reserve Bank of New York, 15/9/2022.
[xi] “September 2022 Manufacturing Business Outlook,” Federal Reserve Bank – Philadelphia, 15/9/2022.
[xii] Ibid.
[xiii] Source: Office for National Statistics, as of 19/9/2022.
[xiv] “Public Opinions and Social Trends, Great Britain: 31 August to 11 September 2022,” Office for National Statistics, 16/9/2022.
[xv] Ibid.
Get a weekly roundup of our market insights.
Sign up for our weekly e-mail newsletter.

You Imagine Your Future. We Help You Get There.
Are you ready to start your journey to a better financial future?

Markets Are Always Changing—What Can You Do About It?
Get tips for enhancing your strategy, advice for buying and selling and see where we think the market is headed next.
Related Resources
-
Market Volatility Some Timeless Counsel After March’s Volatility2026-04-07
-
Market Volatility What the Latest Global Flash PMIs Reveal2026-03-31
-
Market Analysis Will Lower Capital Requirements Send Banks Higher?2026-03-31
-
Politics This Week in Gridlock: Europe Edition2026-03-27


Contact Us
Learn why 200,000 clients trust Fisher Investments and its affiliates to manage their money and find out how we may be able to help you achieve your financial goals.
As of 31/03/2026. Includes Fisher Investments and its affiliates.
New to Fisher? Call Us.
Contact Us Today