Personal Wealth Management / Economics
America’s Economy Grew in Q4
Whilst we think results were mixed under the bonnet, US GDP’s main engines appear to be chugging along.
US gross domestic product (GDP, a government-produced measure of economic output) rose an inflation-adjusted 2.9% annualised in Q4, decelerating slightly from Q3’s 3.2% but topping analysts’ consensus estimate for 2.3%.[i] (Annualised growth rates represent the rate at which GDP would grow over a full year if the quarter-on-quarter percent change repeated all four quarters.) Whilst this suggests to us recession (a broad decline in economic activity) didn’t start in Q4, under the bonnet, we think the data here extend the trend of mixed figures that we observed for much of last year—seemingly allowing many commentators we follow to see whatever they want in the results. For investors, we caution against the potential tendency to extrapolate backward-looking figures.
Start with US GDP’s big private sector components: consumer spending and business investment.[ii] Personal consumption expenditures (PCE), 71% of GDP, rose 2.1% annualised, contributing about half of headline growth.[iii] This slowed from 2.3% the previous quarter, which some commentators we follow suggest indicates trouble lies ahead.[iv] Perhaps. But with inflation (economy-wide price increases) slowing, we would be careful about drawing such conclusions.[v] Trend-wise, PCE growth was led by broad-based services spending—the lion’s share of PCE—with all categories seeing gains last quarter.[vi] Most goods categories also contributed, including motor vehicles and food away from home, which were notable detractors in prior quarters.[vii]
Business investment rose 0.7%, but it was more mixed below the surface.[viii] Intellectual property development (think software, research, media and entertainment) rose 5.3% annualised, continuing a long string of gains.[ix] Structures (commercial and industrial building) also saw slight 0.4% annualised growth after six straight quarterly declines.[x] However, equipment—mainly in information processing—fell -3.7% annualised.[xi] From our observations, though, this series has been quite volatile over the last year and a half amidst supply chain disruptions. However, transportation equipment has now grown three quarters in a row, suggesting to us bottlenecks are easing for that equipment category.[xii]
So overall, putting consumer spending and business investment together, whilst not great, the economy’s two main engines are powering ahead, in our view. But analysts we read allege cracks are forming, which they see in residential investment, inventory changes and net exports (exports minus imports).
Residential investment (think new home sales) fell -26.7% annualised—its seventh consecutive quarterly decline—and follows Q3’s -27.1% drop.[xiii] This lopped off -1.29 percentage points from headline growth—and garnered heaps of attention from commentators we follow, raising alarms.[xiv] Yet GDP grew.[xv] Because housing is only a tiny part of GDP, it is less a swing factor than most commentary portrays.[xvi] Then, too, what sway it does have looks set to shrink to us. Buyers balked from mortgage rates’ big jump last year amidst still-high prices.[xvii] But as we look forward, we have now seen a string of big drops in residential real estate and no recession. In our view, it isn’t all that likely such huge detractions persist into the New Year, especially since rates have eased of late.[xviii]
Meanwhile, we find trade’s 0.56 percentage point contribution to headline GDP growth is less positive than it appears.[xix] Because exports fell -1.3% annualised, whilst imports fell -4.6%, net exports—exports minus imports—gained.[xx] This could be a sign demand is weakening, a valid point, in our view. But here again, we would caution about extrapolating this. Trade is typically a volatile category and was all over the place in 2022.[xxi]
We think Q4’s inventory build, which added 1.46 percentage points to headline growth, is also open to interpretation.[xxii] Commentators we follow say its growth hides underlying weakness. If this represents unwanted inventory accumulation, it could be bad—possibly a sign of excess to be wrung out later. But we wouldn’t jump to this conclusion yet. Q2 and Q3 saw big back-to-back inventory drawdowns, subtracting -1.91 and -1.19 percentage points from their respective GDP growth figures.[xxiii] Inventories may be rebuilding as global supply chains have been restored—amidst ongoing consumer demand. Note as well: Those inventory drawdowns were key to Q2’s GDP contraction. Few analysts we read then called that illusory—and you can’t have it both ways, in our view.
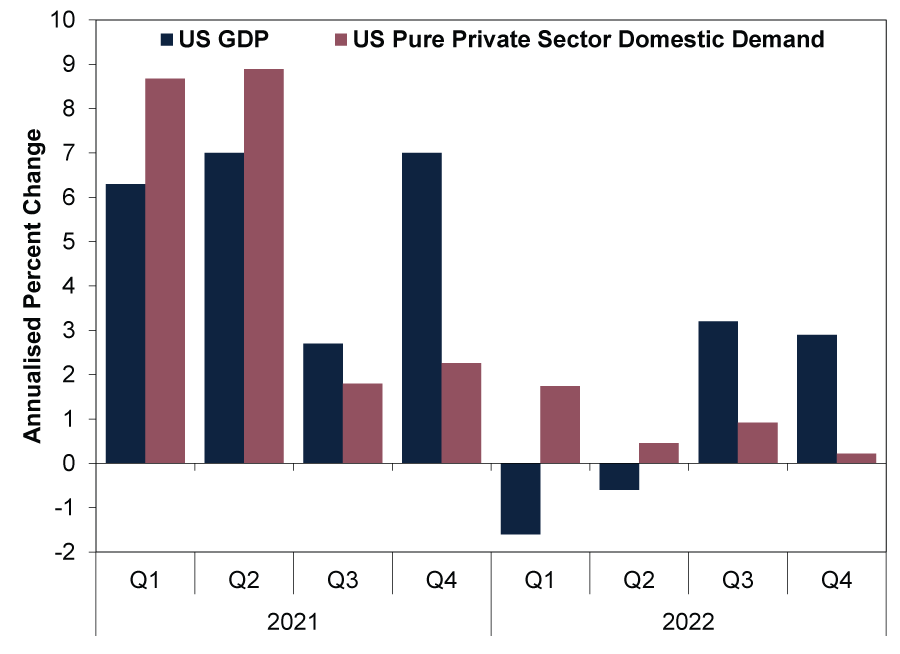
The upshot to all this: Whilst US GDP’s expansion continues, its components are rather mixed, which we think is worth being aware of—and disentangling. A fuller and more detailed picture of the economy’s moving parts can help investors separate reality from the sentiment surrounding it for a better understanding of what markets are contending with. As Exhibit 1 shows, the GDP categories that are more purely about the private sector—PCE, business investment and residential investment—slowed to 0.2% in Q4. In other words, more of the same mixed data from 2022, from our perspective—and likely what stocks discounted last year.
Exhibit 1: America’s Private Sector Demand Growth Slow, but Positive
Source: US Bureau of Economic Analysis, as of 26/1/2023. US GDP and final sales to private domestic purchasers, Q1 2021 – Q4 2022.
[i] Source: US Bureau of Economic Analysis and FactSet, as of 26/1/2023. US GDP and consensus estimate, Q4 2022.
[ii] Source: US Bureau of Economic Analysis, as of 26/1/2023. Statement based on US PCE and private non-residential fixed investment as a percent of GDP, Q4 2022.
[iii] Source: US Bureau of Economic Analysis, as of 26/1/2023. US PCE, Q4 2022.
[iv] Source: US Bureau of Economic Analysis, as of 26/1/2023. US PCE, Q3 2022.
[v] Source: US Bureau of Labor Statistics, as of 26/1/2023. Statement based on the US consumer price index (CPI), December 2022. CPI is a government-produced measure of goods and services prices.
[vi] Source: US Bureau of Economic Analysis, as of 26/1/2023. US PCE, Q4 2022. Statement based on its subcategories.
[vii] Ibid.
[viii] Source: US Bureau of Economic Analysis, as of 26/1/2023. US private non-residential fixed investment, Q4 2022. Statement based on its subcategories.
[ix] Ibid.
[x] Ibid.
[xi] Ibid.
[xii] Ibid.
[xiii] Source: US Bureau of Economic Analysis, as of 26/1/2023. US private residential fixed investment, Q4 2022.
[xiv] Ibid.
[xv] See note i.
[xvi] Source: US Bureau of Economic Analysis, as of 26/1/2023. Statement based on US private residential fixed investment as a percent of GDP, Q4 2022.
[xvii] “Pending Home Sales Increased 2.5% in December, Ending Six-Month Slide,” Staff, National Association of Realtors (NAR), 27/1/2023. Statement based on NAR Chief Economist Lawrence Yun’s observation: “Mortgage rates are the dominant factor driving home sales, and recent declines in rates are clearly helping to stabilize the market.”
[xviii] Ibid.
[xix] Source: US Bureau of Economic Analysis, as of 26/1/2023. US net exports, Q4 2022.
[xx] Ibid.
[xxi] Source: US Bureau of Economic Analysis, as of 26/1/2023. US net exports, Q1 2002 – Q4 2022.
[xxii] Source: US Bureau of Economic Analysis, as of 26/1/2023. US change in private inventories, Q4 2022.
[xxiii] Source: US Bureau of Economic Analysis, as of 26/1/2023. US change in private inventories, Q2 2022 – Q3 2022.
Get a weekly roundup of our market insights.
Sign up for our weekly e-mail newsletter.

You Imagine Your Future. We Help You Get There.
Are you ready to start your journey to a better financial future?

Markets Are Always Changing—What Can You Do About It?
Get tips for enhancing your strategy, advice for buying and selling and see where we think the market is headed next.
Related Resources
-
Environmental, Social and Governance Insights Responsible Investment Newsletter 20262026-03-11
-
Economics Pain at the Petrol Station Won’t Hurt the Global Economy2026-03-11
-
Market Analysis February’s Growthy Data—and the Iran War’s Souring Sentiment2026-03-06
-
Market Analysis Putting the Latest Private Credit Implosion in Perspective2026-03-06


Contact Us
Learn why 195,000 clients trust Fisher Investments and its affiliates to manage their money and find out how we may be able to help you achieve your financial goals.
As of 31/12/2025. Includes Fisher Investments and its affiliates.
New to Fisher? Call Us.
Contact Us Today