Personal Wealth Management / Economics
America’s Households Are Healthier Than Appreciated
US consumers’ balance sheets still seem to us plenty healthy to support consumption.
Faced with better-than-expected April US consumer spending growth in a widely watched Bureau of Economic Analysis (BEA) report released Friday, coverage we read gravitated to storm clouds supposedly gathering.[i] Their focus, which we don’t think is particularly surprising: inflation and how it has challenged many households’ finances over the last year and a half. Overall and on average, America’s consumer spending has held up despite price pressures, suggesting to some commentators we follow that US consumers must be heaping on debt, setting up trouble later. But a look at US spending, income and household finance data argues otherwise, in our view. For investors, we think the negative attitude toward fine data underscores the prevailing pessimism of disbelief, which fosters young bull markets (prolonged, broad stock market appreciation).
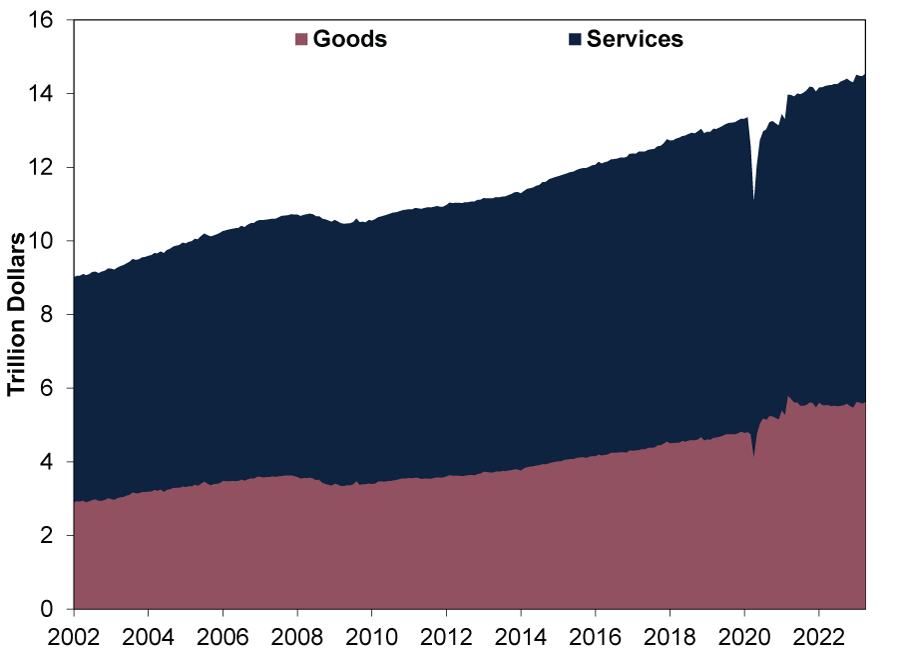
Following a slight -0.2% m/m February dip and flat March, inflation-adjusted or real personal consumption expenditures (PCE, the broadest measure of US consumer spending and 71% of gross domestic product, GDP) rose 0.5% in April, adding to evidence the economy is off to a good start in Q2.[ii] (Exhibit 1) We found Americans’ consumer spending was strong across the board. Services (62% of PCE) not only accelerated to 0.3% m/m growth, but goods expenditures jumped 0.8% after detracting for two months.[iii] Whilst backward looking, broad-based expansion in US GDP’s largest segment suggests to us recession (an economy-wide decline in activity and output) was likely not at hand in early Q2.
Exhibit 1: US PCE Continues Expanding
Source: US Federal Reserve Bank of St. Louis, as of 26/5/2023. PCE goods and services, January 2002 – April 2023.
That said, Americans’ April personal income rose 0.4% m/m, half the rate of their nominal spending.[iv] If outlays exceed income for an extended period, that implies consumers are drawing on savings and, some analyses we read warn, adding debt. This, plus the Federal Reserve’s New York branch report last week that US households saw an uptick in 90-day delinquencies in Q1, further implied to some observers we follow that consumer spending’s growth is on borrowed time.[v]
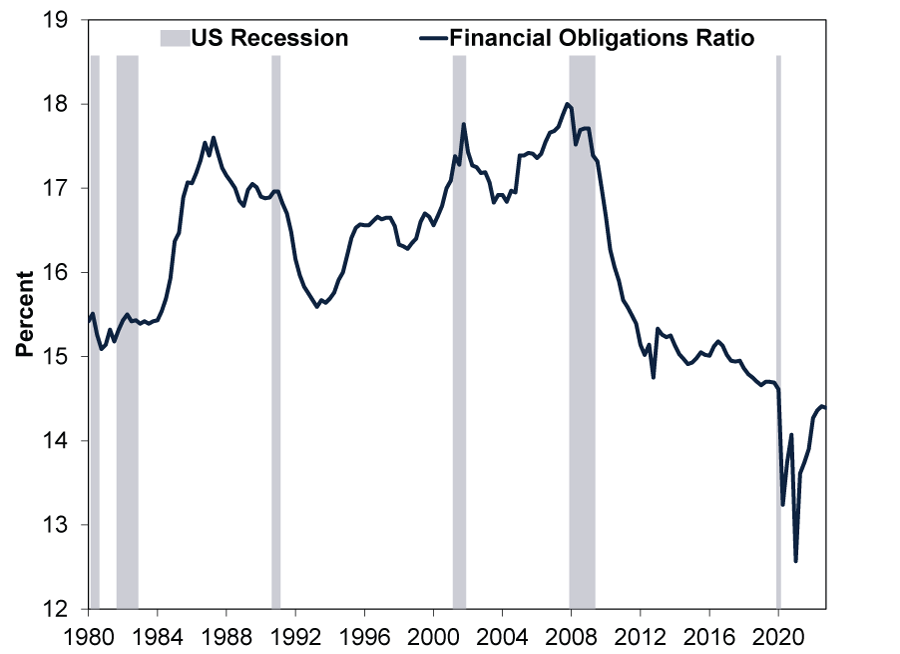
That may sound intuitive—and, potentially, alarming. But we see little evidence to back the narrative America’s consumer debt is crippling demand. For one, US households’ financial obligations ratio remains historically low. (Exhibit 2) This shows Americans’ debt service (interest and principal payments), and it also includes rent, property tax and homeowners’ insurance. In total, the cost of these financial obligations as a percentage of households’ disposable personal income was just 14.4% in Q4—the latest available data point. This could change in the coming quarters, but for now it remains below any level pre-pandemic. Whilst aggregate data like these don’t mean individual households aren’t struggling, little here suggests to us consumers’ nondiscretionary financial obligations are broadly overwhelming their ability to make payments on them—with room to spare.
Exhibit 2: US Households’ Financial Load Historically Light
Source: US Federal Reserve, as of 23/5/2023. Financial Obligations Ratio, Q1 1980 – Q4 2022. US recession shading based on National Bureau of Economic Research business cycle dates.
With incomes more than covering financial obligations, it is little wonder to us US household delinquency rates in aggregate are historically low, too. Whilst they did inch up in Q1, they also remain below any point pre-pandemic, even excluding student loan delinquencies skewed lower by March 2020’s payment moratorium. (Exhibit 3) Now, student loan delinquency rates might rise if the Biden administration’s payment moratorium ends. But we don’t think an increase—from effectively zero—would be surprising, and outside student lending there is little sign of problems to us.
Exhibit 3: US Household Delinquency Rate Low
Source: US Federal Reserve Bank of New York, as of 15/5/2023. Quarterly Report on Household Debt and Credit: Percent of Balance 90+ Days Delinquent by Loan Type, Q1 2003 – Q1 2023. *The US Department of Education has waived federal student loan payments since March 2020.
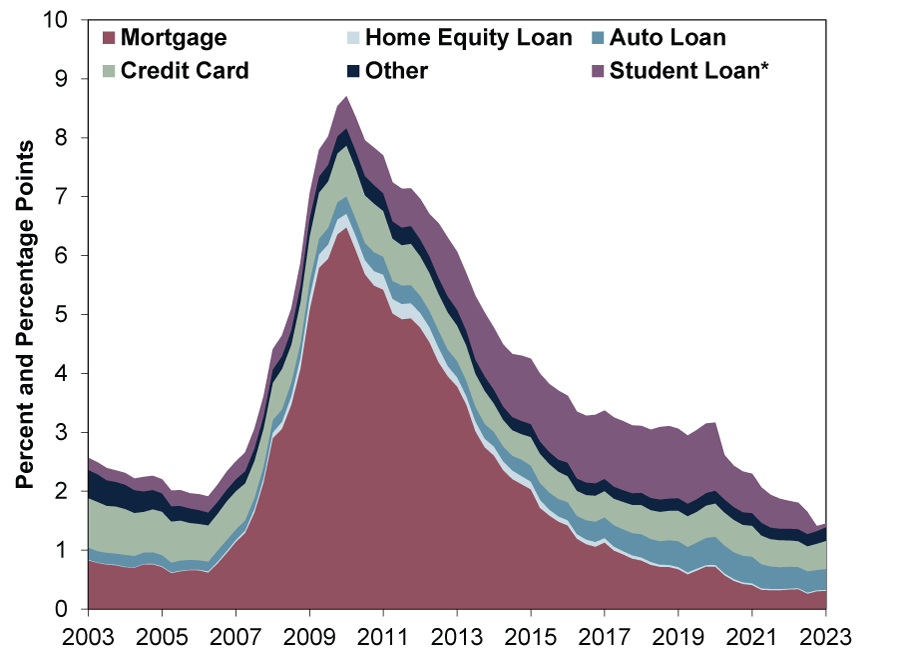
It may also be worth noting that since 2012, student loan 90-day delinquency rates hovered over 10% until the payment moratorium without triggering a financial crisis—partly because almost 79% of those borrowers owe less than $50,000.[vi] US banks have very little exposure in any event, since the US government nationalised student lending. So we aren’t so sure delinquency would spike dramatically whenever the moratorium ends, and even something in the neighbourhood of pre-pandemic rates plus a little bit likely isn’t an enormous macroeconomic headwind.
Of course, households’ health could worsen. But we think markets would likely signal that way in advance and American household finances seem to be in fine shape now. That many commentators we follow still see otherwise illustrates the wide—and bullish—gap between expectations and reality present today, in our view.
[i] Source: BEA, as of 26/5/2023. Statement based on US real personal consumption expenditures (PCE) and FactSet consensus estimate, April 2023.
[ii] Source: BEA, as of 26/5/2023. PCE as a percent of GDP, Q1 2023. GDP is a government measure of economic output.
[iii] Source: BEA, as of 26/5/2023. PCE services as a percent of PCE, April 2023.
[iv] Source: BEA, as of 26/5/2023. US personal income and PCE, April 2023.
[v] Source: Federal Reserve Bank of New York, as of 15/5/2023. Statement based on its Quarterly Report on Household Debt and Credit, Q1 2023.
[vi] “Three Key Facts from the Center for Microeconomic Data’s 2022 Student Loan Update,” Daniel Mangrum, Joelle Scally and Crystal Wang, Federal Reserve Bank of New York, 9/8/2022.
Get a weekly roundup of our market insights.
Sign up for our weekly e-mail newsletter.

You Imagine Your Future. We Help You Get There.
Are you ready to start your journey to a better financial future?

Markets Are Always Changing—What Can You Do About It?
Get tips for enhancing your strategy, advice for buying and selling and see where we think the market is headed next.
Related Resources
-
Macro Insights Brazil Review & Outlook2026-06-04
-
Market Analysis Global Bond Calamity Calls for Calm Perspective2026-05-27
-
Economics A May Global Economic Check-In2026-05-26
-
Macro Insights Macro Insights Q2 20262026-05-22


Contact Us
Learn why 200,000 clients trust Fisher Investments and its affiliates to manage their money and find out how we may be able to help you achieve your financial goals.
As of 31/03/2026. Includes Fisher Investments and its affiliates.
New to Fisher? Call Us.
Contact Us Today