Personal Wealth Management / Market Analysis
America’s Q1 Earnings Season Takeaways
Backward looking, but better-than-expected results undercut pessimistic sentiment, in our view.
The US’s Q1 earnings season is winding down and the 428 S&P 500 companies reporting results so far indicate profits will probably drop slightly year on year, following Q4’s contraction.[i] Still, this tops analysts’ consensus pessimistic expectations overall.[ii] In our view, stocks are forward-looking, pre-pricing future conditions before they arrive based on fears, opinions and forecasts. So we think global stocks’ decline last year—over two-thirds of which are American—likely pre-priced this profit dip.[iii] We think seeing the actual decline—and how shallow it is—should help quell uncertainty and allows them to move on.
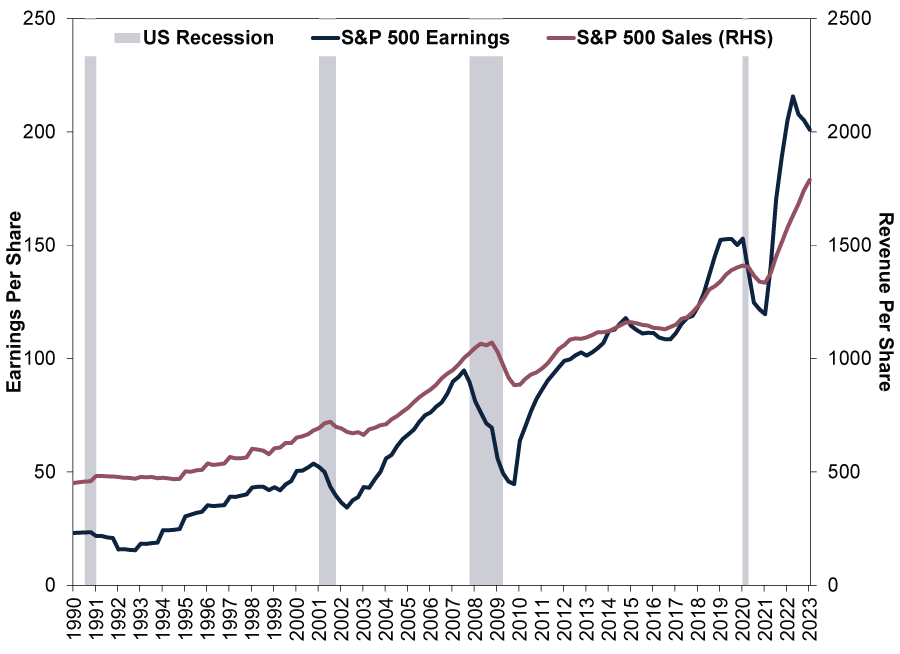
Blended S&P 500 earnings, which combine actual results and estimates of the firms yet to report, have fallen -2.2% y/y, better than the -6.7% the consensus expected at Q1’s end.[iv] Of the companies reporting, 79% beat estimates, above the one-year average of 73% and the five-year average of 77%.[v] Except for Utilities, all sectors have topped analysts’ estimates.[vi] Meanwhile, sales have beaten across the board with the S&P 500’s Q1 blended revenue growth hitting 3.9% y/y versus the 1.9% expected at quarter close.[vii] Exhibit 1 shows what this looks like: Trailing four-quarter sales continued to make new highs in Q1—normal outside of recessions, in our experience—whilst trailing four-quarter earnings have pulled back a bit amidst higher costs.
Exhibit 1: S&P 500 Earnings Have Pulled Back Some, but Sales Going Strong
Source: FactSet, as of 4/5/2023. S&P 500 trailing four quarters earnings and revenues per share, Q1 1990 – Q1 2023. Recession shading based on US National Bureau of Economic Research Business Cycle Expansions and Contractions.
With US revenues growing and costs the main driver of earnings’ decline, a return to growth may hinge on cost-cutting. We find some preliminary evidence of this process starting to have an effect, even if it doesn’t yet show in headline data. Net profit margins—what is left after all expenses (production costs, but also tax, interest, marketing and administrative overhead) as a percentage of sales—edged up to 11.5% in Q1 from Q4’s 11.3%, their first increase in six quarters. (Exhibit 2)
Exhibit 2: S&P 500 Profit Margins Showing Signs of Stabilising
Source: FactSet, as of 4/5/2023. S&P 500 net profit margins, Q1 1990 – Q1 2023. Recession shading based on US National Bureau of Economic Research Business Cycle Expansions and Contractions.
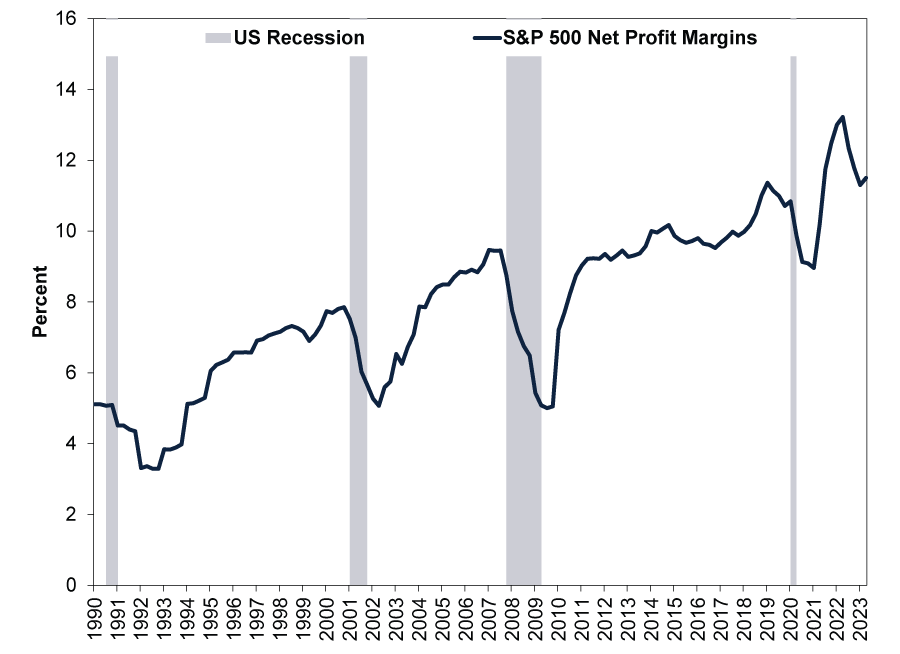
Whilst only one measure of corporate profitability, improving net margins show a greater share of sales is filtering through to the bottom line—and therefore investors. Now, one quarter doesn’t make a trend. But note, although profit margins are off their peak, they remain above any point pre-pandemic—Corporate America’s profitability is still quite substantial. Yet headlines we follow overlook it, suggesting to us some stealthy surprise power lingers.
Of course, entering May, Q1 is rather backward looking, particularly for markets, which we think focus on the 3 – 30 month outlook. Analysts expect Q2 earnings to keep falling year on year, which would be three straight quarterly contractions if Q1’s drop holds.[viii] Yet the S&P 500 has risen 14.6% from 12 October’s low in dollars, which strongly suggests to us stocks have moved on and are looking forward to second-half growth and beyond.[ix] After a global stock market downturn like last year’s, we find stocks typically recover well before earnings.
Apparently sensing better times ahead, US corporations’ Q1 earnings calls have seemed less downbeat, too. According to one compilation, about 40% of calls so far have mentioned recession versus near 60% in Q2 last year.[x] We see this as indicative of sentiment more than anything—executives aren’t necessarily more prescient than anyone else. Just because they appear less concerned doesn’t mean everything is going to be ok—all it reflects is their mood today, in our experience. But as a sentiment gauge, we think it shows recession fears’ grip may be starting to loosen, at least in the US.
We don’t know yet if October’s low will mark stocks’ recovery, but it looks increasingly like it to us. The proverbial wall of worry markets climb remains tall, in our view, leaving plenty of room for reality to exceed expectations and send stocks higher.
[i] Source: FactSet Earnings Insight, as of 5/5/2023.
[ii] Ibid.
[iii] Source: FactSet, as of 5/5/2023. Statement based on the US’s percentage of MSCI World Index market capitalisation (a measure of company size calculated by multiplying shares outstanding and current share price), 5/5/2023.
[iv] See note i.
[v] Ibid.
[vi] Ibid.
[vii] Ibid.
[viii] Ibid.
[ix] Source: FactSet, as of 5/5/2023. S&P 500 total return, 12/10/2022 – 4/5/2023. Presented in US dollars. Currency fluctuations between the dollar and pound may result in higher or lower investment returns.
[x] “Recession Talk Tapers off on Latest Quarterly Conference Calls,” Noel Randewich, Reuters, 3/5/2023. Accessed via the Internet Archive.
Get a weekly roundup of our market insights.
Sign up for our weekly e-mail newsletter.

You Imagine Your Future. We Help You Get There.
Are you ready to start your journey to a better financial future?

Markets Are Always Changing—What Can You Do About It?
Get tips for enhancing your strategy, advice for buying and selling and see where we think the market is headed next.
Related Resources
-
In The News Predictions of an AI dystopia are the height of arrogance2026-03-23
-
Politics Beyond the War: A Political Roundup Covering America, Canada and Denmark2026-03-18
-
Economics Doubts Aplenty After UK January GDP Flatlined2026-03-18
-
Environmental, Social and Governance Insights Responsible Investment Newsletter 20262026-03-11


Contact Us
Learn why 195,000 clients trust Fisher Investments and its affiliates to manage their money and find out how we may be able to help you achieve your financial goals.
As of 31/12/2025. Includes Fisher Investments and its affiliates.
New to Fisher? Call Us.
Contact Us Today