Personal Wealth Management / Market Analysis
As the US Fed’s ‘Dot Plot’ Thickens, Skip the Puzzlement
Forecasts are only ever opinions, and the US Federal Reserve’s don’t appear very clear to us.
Days after the Bank of England (BoE) and US Federal Reserve (Fed) ratcheted their policy rates higher again last week, commentators we follow are still chattering over monetary policy moves. But most talk we hear now isn’t about those rate hikes—they weren’t exactly a shock based on reactions we witnessed and changes in bond yields ahead of the meeting, which implied investors anticipated the move.[i] Rather, consternation from outlets we read concentrated on where policy—especially Fed policy—is heading. We see many warning much more tightening is likely to come, roiling sentiment. As evidence, they point to the Federal Open Market Committee (FOMC)—the Fed’s monetary policy decision-making body—boosting its dot-plot projections for rates’ “appropriate policy path” this year and next.[ii] But, in our view, whilst future policy moves could spur volatility, they don’t dictate market direction—and today’s dot plot doesn’t determine tomorrow’s hikes.
As expected, the Fed raised its fed-funds rate target range 0.75 percentage point for the third straight time to 3.0% – 3.25%.[iii] But most observers we follow expected such a move, so they instead focussed on an unanswerable question: How high does the Fed think rates need to go to break inflation’s (rising prices economy-wide) back? To suss that out, interested parties we saw pored over reams of Fed prognostications released with its rate announcement—the quarterly Summary of Economic Projections (SEP). Bundled within it: a dot plot showing what FOMC participants think rates’ path should look like over the coming years. The midpoint of members’ latest estimates for this year jumped to 4.4% from the prior SEP’s 3.4% in June.[iv] Next year, supposedly, the fed-funds rate will hit 4.6%, up from June’s thinking it would be 3.8%.[v] So it might seem at least another percentage point of rate hikes are baked in.
But slow down. We think the dot plot’s evolution over the past year proves these forecasts aren’t ironclad. In December 2021, the SEP’s dot-plot midpoint had rates ending 2022 at 0.9%.[vi] They were collectively expecting to barely lift rates at all this year. Three months later, March’s dot plot put the fed-funds rate’s 2022 close at 1.9%.[vii] Now it has more than doubled.[viii] We don’t see these projections as forward guidance in any useful sense. All they do is show the FOMC members’ evolving opinions, in our view. We think they underscore that even Fed officials can’t forecast what policy they think will be appropriate—and they decide the rates. If they can’t foretell future policy decisions, what chance do outsiders have?
Seemingly in recognition of forward guidance’s limitations—and forecasting’s difficulties generally—Fed head Jerome Powell apparently forswore giving any in late July. Rather than provide specific direction on the likely size of the Fed’s next move—as he had at all 2022’s FOMC meetings thus far—he elected not to, stating that, “While another unusually large increase could be appropriate at our next meeting, that is a decision that will depend on the data we get between now and then.”[ix] He further noted, “We will continue to make our decisions meeting by meeting, and communicate our thinking as clearly as possible.”[x] A month later at the Fed’s Jackson Hole monetary policy symposium, Powell slipped the hint: “July’s increase in the target range was the second 75 basis point increase in as many meetings, and I said then that another unusually large increase could be appropriate at our next meeting. Our decision at the September meeting will depend on the totality of the incoming data and the evolving outlook.”[xi]
Although it appears Fed officials take pains to remind people they are data dependent, not only is their forward guidance—when they offer any—provisional, they don’t always publicly say what those provisions are, based on our observations. Even when they do, that can change on a whim, too, in our experience. Recall last year when inflation was, in Powell’s words, “transitory.”[xii] From what we could tell, it was until it wasn’t—or, more accurately, until Powell felt the word had outlived its usefulness. We think the thing here is that besides word choice unpredictability, what those words mean is open to interpretation, let alone whether they are even correct or not. Then, in our view, whatever Fed people say, you can’t rely on them doing anyway.
In any event, we don’t think investors need to forecast Fed actions—or agonise over its projections—and the same goes for other monetary policy institutions, like the BoE. According to our analysis, the Fed’s economic influence is much less than most think and typically hits with a lag of around 6 to 18 months. So for instance, we think inflation, inflation expectations and Fed responses to them so far have likely fed into higher borrowing costs—mortgage rates amongst them. As numerous articles we read point out, this is starting to stunt housing activity, which looms large for many folks we interact with. But what is its likely economic impact, really? Q2 US residential investment was only 3% of gross domestic product (GDP, a government-produced measure of economic output).[xiii] That is likely why the Fed’s Atlanta branch shows its GDPNow model estimating Q3 output growing slightly despite forecasting a -24.5% annualised (one quarter’s growth if repeated for a year) residential investment decline.[xiv] Despite the common narrative around 2008, a housing downturn alone isn’t likely to drive a deep recession (broad economic contraction), in our view.
A look at how monetary policy works also shows why we think the current rate hike campaign is overrated. We find the main way Fed policy transmits to the economy is through bank lending—but there has been an unappreciated disconnect here. Normally, when the Fed hikes its short-term rates, US banks raise their deposit rates in near lockstep.[xv] But US savings accounts are averaging 0.17% nationally—not close to 3%.[xvi] According to our research, this is important since the interest banks pay on their deposits represent their funding costs on new loans they make. The difference between what they take in from their lending rates and what they pay out on deposits is key to their net interest margins.
Why the disconnect between fed-funds and deposit rates? See Exhibit 1. It seems to us banks are flooded with deposits—having more than they know what to do with, they don’t have to compete to attract funds.
Exhibit 1: US Banks’ Deposit Flood Short Circuits the Fed’s Main Policy Transmission Mechanism
Source: US Federal Reserve Bank of St. Louis, as of 26/9/2022. Deposits and loans and leases in bank credit for all US commercial banks, 3/1/1973 – 14/9/2022.
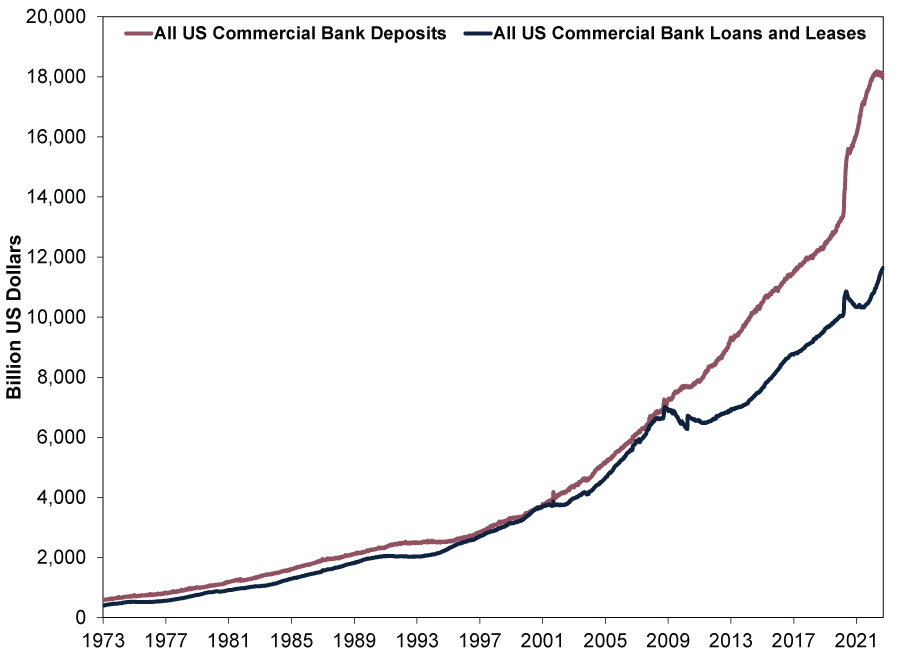
With banks’ funding costs still effectively zero and 10-year benchmark US Treasury rates hitting new highs—they are at 3.9% today—net interest margins are widening.[xvii] Greater loan profitability is typically an incentive to increase lending. We don’t see this as theoretical. Total US bank loan growth accelerated to 11.3% y/y through 14 September, just shy of its May 2020 11.6% pandemic-lockdown peak rate without any emergency government support.[xviii] This could change, but as of now it seems quite inconsistent with a deep recession to us.
The Fed has some influence over the economy, but in our view, it is far from all-powerful. More often than not, we find it mostly befuddling—which is fine. We don’t think there is any need to decipher its decision-making twists and turns. However, our research shows reactions to those may be helpful in divining broad market sentiment. Dour expectations in that regard lately suggests to us reality is probably better than widely perceived.
[i] Source: FactSet, as of 26/9/2022. Statement based on three-month US Treasury yields.
[ii] Source: US Federal Reserve, as of 21/9/2022.
[iii] Source: FactSet, as of 26/9/2022. Statement based on FactSet’s consensus estimate for the fed-funds rate target range’s upper bound, 20/9/2022.
[iv] Source: US Federal Reserve, as of 21/9/2022.
[v] Ibid.
[vi] Ibid.
[vii] Ibid.
[viii] Ibid.
[ix] “Fed’s Powell’s Absence of Specific Guidance Leaves Analysts to Fill the Gaps,” Ann Saphir, Reuters, 27/7/2022.
[x] Ibid.
[xi] “Monetary Policy and Price Stability,” Jerome Powell, US Federal Reserve, 26/8/2022.
[xii] “Jerome Powell Ditches ‘Transitory’ Tag, Paves Way for Rate Hike,” Rich Miller, Bloomberg, 30/11/2021. Accessed via Investing.com
[xiii] Source: US Bureau of Economic Analysis, as of 26/9/2022.
[xiv] Source: US Federal Reserve Bank of Atlanta, as of 26/9/2022.
[xv] Source: US Federal Reserve Bank of St. Louis, as of 26/9/2022.
[xvi] Ibid.
[xvii] Ibid.
[xviii] Ibid.
Get a weekly roundup of our market insights.
Sign up for our weekly e-mail newsletter.

You Imagine Your Future. We Help You Get There.
Are you ready to start your journey to a better financial future?

Markets Are Always Changing—What Can You Do About It?
Get tips for enhancing your strategy, advice for buying and selling and see where we think the market is headed next.
Related Resources
-
Market Volatility Some Timeless Counsel After March’s Volatility2026-04-07
-
Market Volatility What the Latest Global Flash PMIs Reveal2026-03-31
-
Market Analysis Will Lower Capital Requirements Send Banks Higher?2026-03-31
-
Politics This Week in Gridlock: Europe Edition2026-03-27


Contact Us
Learn why 200,000 clients trust Fisher Investments and its affiliates to manage their money and find out how we may be able to help you achieve your financial goals.
As of 31/03/2026. Includes Fisher Investments and its affiliates.
New to Fisher? Call Us.
Contact Us Today