Personal Wealth Management / Market Analysis
Bad Breadth Likely Won’t Stop This Bull Market
If anything, we think warnings about market breadth help extend stocks’ gains.
Amongst financial commentators we follow, a common theme has begun emerging: Fewer and fewer stocks are performing well—so-called narrowing market breadth—which they argue means this bull market is fragile. Don’t buy it—in our view, this is faulty logic. Our research shows narrowing breadth is normal as bull markets (long periods of generally rising equity markets) mature, and there is no preset level indicating the bull market’s end is near. To us, it is just another sign this less-than-two-year-old bull market is acting late stage.[i] However, we think widespread alarm over typical bull market behaviour is yet another indication stocks likely have more room to run.
There are several different ways to measure market breadth. Some observers look at the number of stocks hitting new 52-week lows, which are currently far outpacing new highs.[ii] Others track the “advance-decline line”—the ratio of rising stocks to declining ones. Last week in America, some commentators we follow touted the fact daily decliners on the New York Stock Exchange and Nasdaq outnumbered advancers by about four to one.[iii] Our preferred measure is the percentage of stocks outperforming the index average. Using the S&P 500 for its long history, Exhibit 1 shows this jumped to 61% in early 2021 amidst optimism over mass vaccine rollouts and global economic reopening. But it has steadily declined since last May, with only 44% now beating the index on a rolling 12-month basis.
Exhibit 1: Narrowing Market Breadth Doesn’t Always Spell Doom
Source: Clarifi, as of 13/1/2022. Percent of S&P 500 stocks beating the trailing 12-month S&P 500 total return, 12/1/1976 – 12/1/2022. Presented in US dollars. Currency fluctuations between the dollar and pound may result in higher or lower investment returns.
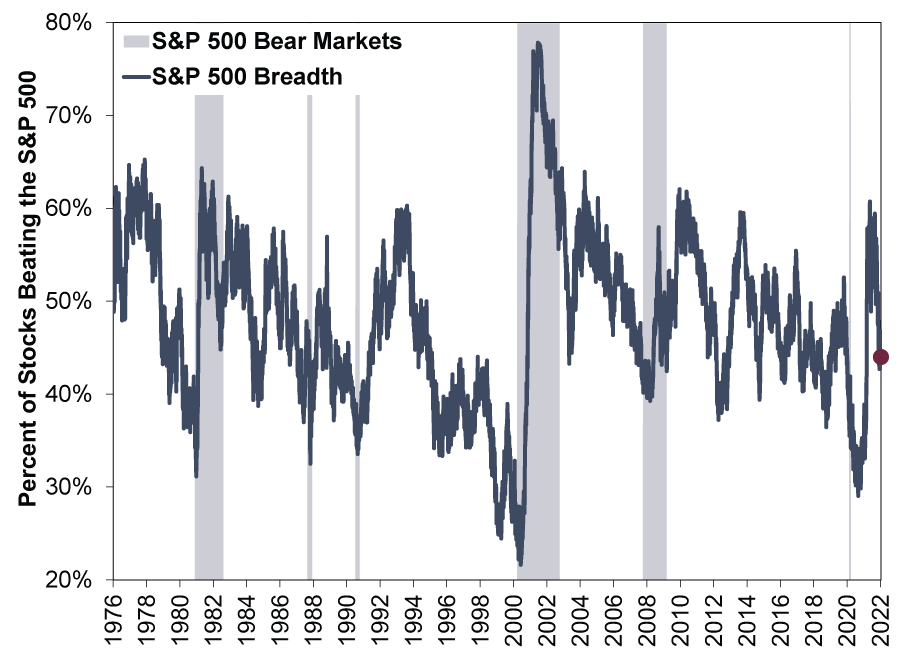
When the current S&P 500 bull market began in March 2020, its breadth (as we define it) was below 40%. It stayed low through the rest of the year. Spring 2021’s subsequent broad-based gains weren’t unwelcome, in our view, but the narrowing breadth that followed in 2021’s second half didn’t stop the bull market, either.
Narrow breadth at the market cycle’s start is atypical, based on our research. Ordinarily, in the depths of bear markets (typically long, deep declines of -20% or worse with fundamental causes), we find depressed sentiment often overshoots reality by miles and many small-capitalisation and value-orientated stocks—the majority of publicly traded companies—crater the most.[iv] In our view, this is because smaller, value-orientated stocks tend to be economically sensitive, have slim profit margins and rely on debt financing, and they therefore get punished disproportionately in a bear market.[v] We think this is because investors sell this category indiscriminately due to the perceived risk of smaller, less profitable companies going bankrupt when credit freezes in a recession. Our analysis shows the ones surviving, though, are mostly running lean and mean, after frozen credit markets and sagging sales forced them to slash costs. We think this means that, as the economy revives, their earnings growth can soar off low bases. According to our research, markets—anticipating earnings’ upswing—often launch these stocks upward well before recessions (broad-based declines in economic activity) officially end. This is why we think in standard market and business cycles, small-capitalisation and value stocks generally lead off a bear market low—and why breadth is usually high early in a bull market.[vi] For example, coming out of 2007 – 2009’s bear market, the S&P 500’s breadth hit over 55% routinely through 2011.[vii]
Our research shows that later in the cycle, after the initial upsurge, there are fewer winners. We find as bull markets mature, earnings growth tends to slow significantly, and many companies reach the end of what they can squeeze out by cutting costs (largely under their control) and must rely increasingly on revenue growth (less controllable) to drive earnings. Then too, we also find economic growth usually slows to a more pedestrian pace after the recovery phase out of recession—as economic activity hits its prior peak and begins a new expansion phase.
At this point, according to our analysis, it can get harder for companies to outperform. In our view, this is when large-capitalisation and growth-orientated stocks tend to take the leadership reins, as their higher-quality characteristics shine. We think this is because larger, growth-orientated stocks feature strong balance sheets, high margins and growth prospects independent from the broader economy’s, which allows them to stand out from the crowd—they are able to generate earnings on their own accord when others may begin to flounder. In our view, since there aren’t as many stocks with high-quality, growth traits, breadth narrows.
That is what we think normally happens. But as we noted, this cycle’s breadth looks very different to us—narrow out of the gate with a brief bump early last year that subsided fast. In our view, this is due to the lockdown bear market’s very unusual cause—and duration. We think it was too short to reset the cycle. The same for the fleeting downturn’s effect on the broad economy. Our research shows the economic decline caused by lockdowns was short and sharp, coming when businesses hadn’t built up a lot of excess and inefficiency, whilst lockdowns—and associated government support—suspended economic activity. As those ended, we think the economy overall picked up where it left off, which is why large-capitalisation, growth-orientated stocks have led throughout—supercharged early by big growth firms’ business models being very aligned with a locked-down world, in our view.[viii]
Looking back on the whole from our perspective, what that leaves is a young bull market with an old soul. If you treat 2020’s lockdown-driven bear market as a hugely oversized correction (typically a sharp, sentiment-fuelled decline of -10% to -20%), stocks are behaving to us as if this new bull market is a continuation of 2009 – 2020’s. Narrow breadth and growth leadership characterised the previous one as it ended, as the chart showed.[ix] In our view, those features reasserted themselves immediately in this one. Our research suggests the new bull market just resumed the same late-cycle behaviour as before global lockdowns temporarily interrupted.
This time around, many commentators we follow claim narrow breadth makes the bull market fragile. If the few stocks leading falter, they posit, the market will plummet. But as our historical analysis shows, whilst market breadth does narrow as bull markets age, there is no magic level indicating a problem. Look back to Exhibit 1. The S&P 500’s breadth was under 40% in 2012, 2014 and 2018. None signalled an imminent end to the bull market. In the 1990s’ bull market, breadth was below 40% through most of its latter half, hitting 24% at the market’s March 2000 peak.
In our view, fears over narrow market breadth show sentiment is far from the euphoria that we find typifies market tops—when euphoria pushes expectations to levels reality can’t possibly attain—and leads investors to dismiss risks. We think it is that feature which usually makes bull markets fragile—not narrow breadth.
[i] Source: FactSet, as of 18/1/2022. Dating based on the S&P 500 Index in US dollars, which began this bull market on 23/3/2020. Currency fluctuations between the dollar and pound may result in higher or lower investment returns.
[ii] “Wall Street Tumbles as Tech Stocks Extend Slide,” Bansari Mayur Kamdar and Shreyashi Sanyal, Reuters, 10/1/2022. Accessed via Yahoo!
[iii] Ibid.
[iv] Source: FactSet, as of 18/1/2022. Statement based on number of S&P 500 Value and Growth constituents, 18/1/2022.
[v] Ibid. Statement based on MSCI World Growth and Value Index returns with net dividends.
[vi] Ibid.
[vii] Source: Clarifi, as of 13/1/2022. Percent of S&P 500 stocks beating the trailing 12-month S&P 500 total return, 8/10/2009 – 8/4/2011. Presented in US dollars. Currency fluctuations between the dollar and pound may result in higher or lower investment returns.
[viii] See note iv.
[ix] Ibid.
Get a weekly roundup of our market insights.
Sign up for our weekly e-mail newsletter.

You Imagine Your Future. We Help You Get There.
Are you ready to start your journey to a better financial future?

Markets Are Always Changing—What Can You Do About It?
Get tips for enhancing your strategy, advice for buying and selling and see where we think the market is headed next.
Related Resources
-
Politics Beyond the War: A Political Roundup Covering America, Canada and Denmark2026-03-18
-
Economics Doubts Aplenty After UK January GDP Flatlined2026-03-18
-
Environmental, Social and Governance Insights Responsible Investment Newsletter 20262026-03-11
-
Economics Pain at the Petrol Station Won’t Hurt the Global Economy2026-03-11


Contact Us
Learn why 195,000 clients trust Fisher Investments and its affiliates to manage their money and find out how we may be able to help you achieve your financial goals.
As of 31/12/2025. Includes Fisher Investments and its affiliates.
New to Fisher? Call Us.
Contact Us Today