Personal Wealth Management / Economics
Digging Into America’s Retail Sales
We think a look under the bonnet at US retail sales helps reveal how American consumers are responding to rising prices.
How are high petrol prices affecting the global economy? Many observers we follow have tried to answer that question by focusing on UK retail sales, which fell -1.4% m/m on an inflation-adjusted basis in March.[i] We agree those are worth a look, but we question how telling they are, considering we see a lot of pandemic-related skew lingering in UK economic data. So we think it is helpful to take a look at the world’s largest consumer market—America—which happens to be further along in the post-pandemic reopening process, for additional clues. US retail sales rose 0.5% m/m in March, but excluding petrol stations, they fell -0.3%, sparking stagflation concerns.[ii] Stagflation, or high inflation (an economy-wide rise in prices) amidst stagnant economic growth, often connotes 1970s-style economic malaise amongst commentators we follow, but we don’t think those comparisons—or the alleged ramifications for markets—are apt. Retail sales are only a subset of consumer spending, but in our view, the glimpse they give still shows America’s household demand holding relatively firm in the face of higher prices.
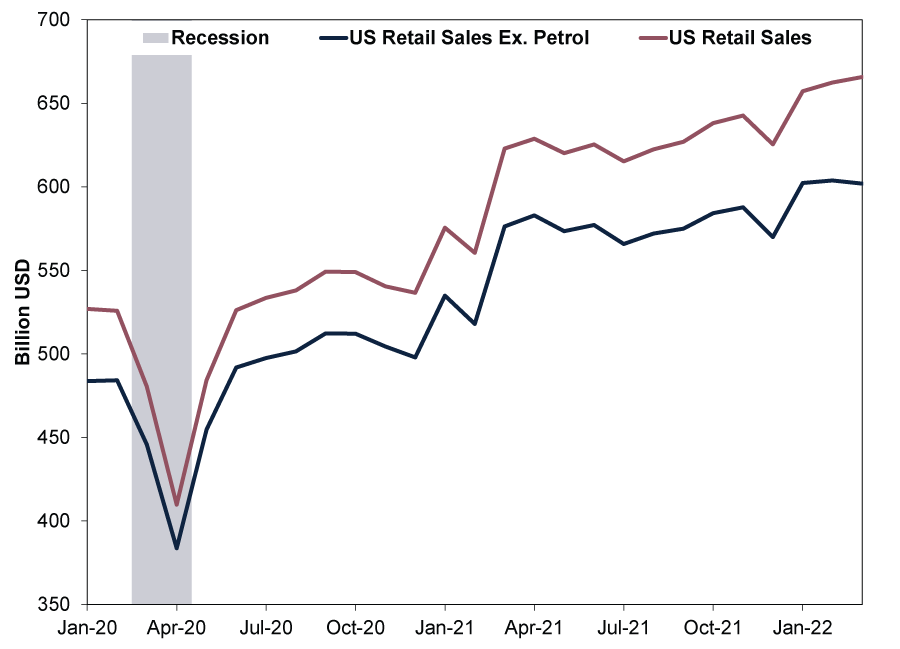
Exhibit 1 depicts the slight divergence between US retail sales with and without petrol spending last month. As pump prices hit a record-high US national average of $4.33 per gallon (87.71 pence per litre) in March, America’s petrol station sales soared 8.9% m/m, which drove its retail sales’ monthly gain.[iii] These figures aren’t adjusted for inflation, so we think it seems fair to say rising prices were responsible for much of the increase.
Exhibit 1: US Retail Sales’ Latest Wiggles in Perspective
Source: Federal Reserve Bank of St. Louis, as of 14/4/2022.
Factor in America’s 1.2% m/m consumer price index (CPI) increase in March, which was largely energy driven, and commentators we read suggest real (inflation-adjusted) US consumption is weaker under the surface than the headline figure implies.[iv] Maybe, in our view, but that presumes using CPI to deflate (inflation adjust) retail sales gives anything more than a rough picture of retail sales volumes—the amount of goods exchanged independent of their value. Problem is, the categories US CPI covers, which skew heavily toward services, are far broader than what America’s retail sales cover and the weights don’t match, so we think it is better to compare category by category.
We think the evidence here is mixed. Take food services, the only services category in the US Commerce Department’s retail sales report, which rose 1.0% m/m in March.[v] The roughly corresponding CPI category—food away from home—rose 0.3% m/m.[vi] Spending here outpaced inflation. On the other hand, whilst American grocers’ sales rose 1.3% m/m, US CPI’s food at home line item rose 1.5%.[vii] That is a rather granular look, in our view, which makes it hard to disentangle the overall effects—particularly when most services aren’t considered. The US Bureau of Economic Analysis (BEA) will provide a much more comprehensive report on America’s March consumer spending—personal consumption expenditures (PCE), which includes services spending and, unlike retail sales, adjusts for inflation—on 29 April.[viii]
Whilst last month’s US retail sales ex. petrol dip is noteworthy, we think markets look at the bigger picture. Retail sales represent less than half of US PCE and less than a third of its gross domestic product (GDP, a government measure of economic output).[ix] Our research shows not only are they not terribly representative, they are also backward looking. For forward-looking stocks, in our view, they don’t say anything about where the bulk of consumer spending is headed. We think it is obvious high petrol prices helped petrol station sales in terms of the amount spent—and may have detracted from other categories—but that doesn’t strike us as a very earthshattering observation, much less one markets haven’t figured out already. That is one reason why we have found American economists like to strip out petrol—and autos, building materials and food services to boot—for a view of so-called core retail sales. Those items tend to be volatile month to month and give little indication of sales’ longer-term direction.[x] Whilst core US retail sales ticked -0.1% m/m lower in March, February’s results were revised higher, prompting some outlets we follow to raise their Q1 US GDP estimates.[xi] But even here, we still think the series is widely watched, backward looking and not predictive.
Based on our research, stocks care more about the economy’s overall trend over the next 3 – 30 months, which is why they are (in our opinion) good at looking through short-term turbulence. For example, when US retail sales dipped in spring and summer 2021 following late-2020 and early-2021’s initial reopening surge, the S&P 500 rose 11.1% in USD through their April to July slide.[xii] Now, with stocks in a correction (short, sharp, sentiment-driven -10% to -20% pullback) early this year, we think close inspection of incoming economic data for signs of weakness is par for the course amidst market volatility—and the barrage of financial news stories about Chinese lockdowns and the potential for escalating geopolitical conflict.[xiii] But we think slowing US growth stems to a noteworthy degree from a return to normal pre-pandemic patterns, which was always likely post-reopening. Retail sales’ following that script isn’t likely to derail the bull market (a long period of generally rising stocks), in our view.
On that note, digging further under the bonnet, we think America’s March retail sales had some encouraging nuggets. Online sales moderated, but this seems tied to the return to pre-pandemic habits to us.[xiv] Meanwhile, 10 of 13 retail categories grew, including furniture; electronics; building and garden supplies; clothing; sporting goods and hobbies; appliances; and restaurants.[xv] We think such broad contributions undercut the notion food and energy prices are prohibitive.
Whilst US auto sales fell, our research shows this was because of ongoing shortages—not because the demand isn’t there. Good Friday’s US industrial production report showed American motor vehicle production jumped 12.5% m/m in March, suggesting component bottlenecks are starting to ease there, but the level remains -10.3% below its pre-pandemic February 2020 level, and auto inventories are still near all-time lows.[xvi] Wards Auto estimates February inventories in the US were just 107,390, up slightly from September 2020’s record-low 105,780.[xvii] Considering inventory levels usually average around 1.3 million, we don’t think it is any wonder cars are scarce—and expensive.[xviii] The BEA reports America’s auto inventory-to-sales ratio hit a record low 0.373 in February.[xix] Normally, it is about 2.5.[xx] Car demand is far from representative of overall US household expenditures, but there is very little here that suggests to us American consumers are faltering.
Meanwhile, other reports indicate US services for travel and recreation are surging. The latest high-frequency data, which we hasten to add aren’t seasonally adjusted and provide only a narrow (backward-looking) scope into consumer behaviour, show airline travel, hotel occupancy and movie ticket sales numbers are all close to getting back to pre-pandemic levels.[xxi] More broadly, filling out America’s economic puzzle, March’s US Institute for Supply Management services purchasing managers’ index (PMI) rose 1.8 points to 58.3, signalling widening expansion as levels over 50 imply growth.[xxii] Then, too, 17 of 18 services industries—representing the lion’s share of the US economy—reported expanding business activity, with only agriculture, forestry, fishing and hunting decreasing.[xxiii] Moreover, US services PMI new orders rose 4.0 percentage points to 60.1; a good sign American growth is set to continue in Q2.[xxiv]
In our view, such a big gap opening up between reality and expectations—as stagflation fears brew despite healthy underlying economic fundamentals—suggests a big engine for the global bull market to climb the proverbial wall of worry remains in gear.
[i] Source: UK Office for National Statistics, as of 22/4/2022.
[ii] Source: US Department of Commerce, as of 14/4/2022.
[iii] “Higher Gasoline Prices Flatter U.S. Retail Sales; Consumers Remain Resilient” Lucia Mutikani, Reuters, 14/4/2022.
[iv] Source: US Bureau of Labor Statistics, as of 12/4/2022.
[v] See note ii.
[vi] See note iv.
[vii] See notes v and vi.
[viii] Albeit one day after the BEA releases Q1 US GDP, which includes March PCE data.
[ix] Source: Federal Reserve Bank of St. Louis, as of 18/4/2022. January, February and March retail sales annualised as a percentage of Q1 PCE and GDP annualised.
[x] See note ii.
[xi] Ibid.
[xii] Source: FactSet, as of 20/4/2022. S&P 500 total return in USD, 31/3/2021 – 31/7/2021. Currency fluctuations between the dollar and pound may result in higher or lower investment returns.
[xiii] Source: FactSet, as of 22/4/2022. Statement based on MSCI World Index return in GBP with net dividends.
[xiv] See note ii.
[xv] Ibid.
[xvi] Source: FactSet, as of 20/4/2022. US motor vehicle production, February 2020 – March 2022.
[xvii] Ibid. Wards Auto unit inventory level estimate, January 1967 – February 2022.
[xviii] Ibid.
[xix] Source: Federal Reserve Bank of St. Louis, as of 20/4/2022. Auto inventory/sales ratio, January 1993 – February 2022.
[xx] Ibid.
[xxi] “Four High Frequency Indicators for the Economy,” Bill McBride, Calculated Risk, 18/4/2022.
[xxii] Source: ISM, as of 5/4/2022. Services PMI, March 2022.
[xxiii] Ibid.
[xxiv] Ibid.
Get a weekly roundup of our market insights.
Sign up for our weekly e-mail newsletter.

You Imagine Your Future. We Help You Get There.
Are you ready to start your journey to a better financial future?

Markets Are Always Changing—What Can You Do About It?
Get tips for enhancing your strategy, advice for buying and selling and see where we think the market is headed next.
Related Resources
-
Market Analysis Why El Niño Doesn’t Necessitate Portfolio Shifts2026-07-02
-
Market Analysis Today in Brexit, Day 3,652: Brexit Turns 102026-06-24
-
Market Analysis Reviewing America’s Q1 Earnings and What Q2 Expectations Say2026-06-23
-
Politics Revolving Door Turns, Uncertainty Starts Falling2026-06-23


Contact Us
Learn why 200,000 clients trust Fisher Investments and its affiliates to manage their money and find out how we may be able to help you achieve your financial goals.
As of 31/03/2026. Includes Fisher Investments and its affiliates.
New to Fisher? Call Us.
Contact Us Today