Personal Wealth Management / Market Analysis
Don’t Put Too Much Stock in Monetary Policy Institutions’ Forecasts
According to our research, those forecasts are imperfect and no roadmap for what monetary officials will do next.
Will the European Central Bank (ECB) raise interest rates sooner than expected? That is a question several financial publications we follow asked after Financial Times reported the ECB anticipates hitting its 2% year-over-year inflation target by 2025 based on internal, unpublished research.[i] We have seen some market observers speculate that if this projection lands true, that would fulfill the ECB’s purported conditions for considering raising interest rates—which could mean the ECB hikes rates as soon as 2023’s close. Whilst that timeframe may sound distant relative to the present, we have seen analysts argue it is much earlier than most experts anticipate, sending some scampering to recalibrate their outlooks. However, we caution investors against putting too much stock into monetary officials’ forecasts—they aren’t blueprints for future monetary policy, in our view.
We have seen a broad mix of responses to the revelation of the ECB’s internal research, ranging from recommendations to refrain from concluding anything concrete to questions about the monetary policy institution’s transparency. Our takeaway is much more high-level: Monetary policy decision-making isn’t a clear-cut process. We don’t find it surprising monetary officials consider a host of information, including internal research, and the ECB’s economists are likely running through myriad scenarios and hypotheticals that could influence policymakers’ thinking. However, these additional inputs and perspectives don’t necessarily make the ECB’s forecasts extremely telling, in our view.
We can test this by reviewing their past forecasts to see how they aligned with what actually happened. Consider the Eurosystem staff’s—which comprises both the ECB and the eurozone’s national monetary policy institutions—three-year forecast of gross domestic product (GDP, a government measure of economic output) and inflation (the general rise in prices economy-wide) issued in December 2016. Their estimates for 2017 – 2019 were mixed—occasionally close and occasionally quite off. (Exhibit 1)
Exhibit 1: The Eurosystem’s Three-Year Projections From December 2016
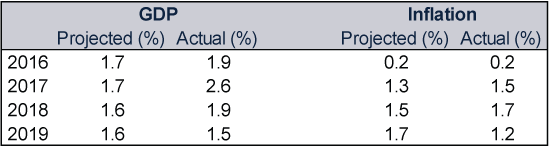
Source: ECB and Eurostat, as of 20/9/2021. Eurosystem staff’s December 2016 eurozone macroeconomic projections for 2016 – 2019 and annual percent change in eurozone Harmonised Index of Consumer Prices (HICP) and GDP, 2016 – 2019.
Our research shows this hit-and-miss record isn’t unique to the ECB. Other countries’ monetary policy institutions also make economic projections, and their success rate is mixed, too. Exhibit 2 highlights the Bank of England’s (BoE) medium-term projections from its November 2016 “Inflation Report,” whilst Exhibit 3 shows the US Federal Reserve’s (Fed) three-year estimates following its mid-December meetings the same year. Similar to the ECB’s forecast, the BoE and Fed sometimes overshot, sometimes undershot, but rarely did they get it exactly right—especially the further out the projection was from the present.
Exhibit 2: The BoE’s Three-Year Projections From November 2016
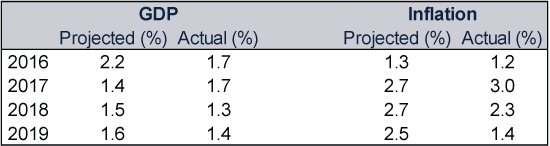
Source: Bank of England’s Inflation Report: November 2016 and FactSet, as of 20/9/2021. Calendar-year growth in real GDP and year-over-year change in the UK Consumer Price Index (CPI), 2016 – 2019. Note: Inflation data here reflect percent change from the fourth quarter of the previous year to the fourth quarter of the indicated year.
Exhibit 3: The Fed’s Three-Year Projections From December 2016
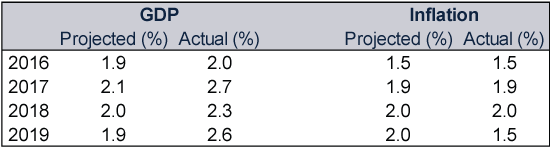
Source: US Federal Reserve and FactSet, as of 20/9/2021. Fed projections based on “Economic projections of Federal Reserve Board members and Federal Reserve Bank presidents under their individual assessments of projected appropriate monetary policy, December 2016.” Change in GDP and inflation are percent changes from the fourth quarter of the previous year to the fourth quarter of the indicated year. Inflation metric cited here is the personal consumption expenditures (PCE) price index.
Note, we aren’t criticising monetary officials for their imperfect estimates—divining the future is no easy task. Besides, we have often heard officials remind observers that these forecasts are based on the inputs they have today—which could morph, change or even be revised. However, the myopic focus on monetary policy institutions’ projections we see constantly amongst financial publications we follow ties back to what we consider a foolhardy effort to predict monetary policy. We have observed some analysts treat monetary officials’ forecasts as a roadmap to future policy: e.g., if a monetary policy institution projects a certain inflation rate, investors can then correctly guess policy decisions in advance—especially if the institution has publicly communicated specific criteria for making certain moves. Yet this thinking relies on many presumptions, in our view. Beyond the forecasts being correct—which they often aren’t—monetary officials will then have to act in a predictable manner. Yet our research shows they have a history of changing their minds even after data reach their self-imposed thresholds. Former BoE Governor Mark Carney used 7% unemployment as a rate hike threshold in 2013—yet as the unemployment rate neared that level the next year, he revised his guidance.[ii] Similarly, in the US, the Fed said it wouldn’t consider raising short-term interest rates until the US unemployment rate fell to 6.5% or lower.[iii] But when the rate approached that threshold, the Fed updated its criteria.[iv] Then-Fed Chair Janet Yellen also commented in 2014 that an initial rate hike would occur some six months after quantitative easing’s (QE) end.[v] (The Fed didn’t hike rates until more than a year later.) Said differently, monetary authorities’ targets aren’t the only factor officials apparently weigh.
Note, too, our research shows markets don’t have pre-set reactions to monetary officials’ decisions. Consider rate hikes, which many view as an automatic economic negative, in our experience. We have seen many experts argue that if monetary officials make it more expensive to borrow money (i.e., adopt tighter monetary policy), households and businesses will have a harder time accessing capital to deploy on spending and investment, which in turn weighs on economic growth. This concern dominated coverage we read in 2015 as experts warned the Fed’s first rate hike of that cycle would likely stoke volatility and ripple globally. However, reality turned out to be much more benign than anticipated, as shown by the history immediately following the Fed’s initial rate hike in December 2015. In the six months following that rate hike, America’s S&P 500 Index rose 1.4% in dollars; 12 months later, returns improved to 11.3%.[vi] US GDP grew 1.7% in 2016.[vii] Overall, our research shows returns after initial rate hikes are routinely positive and have never ended a bull market (a period of generally rising broad equity markets). This doesn’t mean rate hikes are always and everywhere a positive, in our view. Rather, we think it illustrates a broader point: If there is no pre-set reaction to monetary policy, trying to predict monetary officials’ actions based on myriad shifting variables seems like an unnecessary exercise for investors—their time would likely be better spent elsewhere, in our view.
[i] “ECB's Lane Reveals in Private Meeting Inflation Target May Be Met by 2025 – Report,” Francesco Canepa, Reuters, 16/9/2021. Accessed via Yahoo! Finance.
[ii] “BoE’s Carney Unveils ‘Next Phase’ of Forward Guidance,” Katrina Bishop, CNBC, 12 February 2014.
[iii] “Fed Gives Itself a New Target,” Stephanie Flanders, BBC, 13 December 2012.
[iv] “Fed Minutes: Committee Agreed 6.5% Threshold Was ‘Outdated,’ Vote to Remove Was Unanimous,” Jeff Cox, CNBC, 9 April 2014.
[v] “Wall St Drops After Yellen Moves Up Possible Rate Hike,” Staff, Reuters and CNBC, 20 March 2014.
[vi] Source: FactSet, as of 21/9/2021. S&P 500 Total Return Index, 16/12/2015 – 16/6/2016 and 16/12/2015 – 16/12/2016. Presented in US dollars. Currency fluctuations between the dollar and pound may result in higher or lower investment returns.
[vii] Ibid. US GDP, annual percent change, 2016.
Get a weekly roundup of our market insights.
Sign up for our weekly e-mail newsletter.

You Imagine Your Future. We Help You Get There.
Are you ready to start your journey to a better financial future?

Markets Are Always Changing—What Can You Do About It?
Get tips for enhancing your strategy, advice for buying and selling and see where we think the market is headed next.
Related Resources
-
Macro Insights Q1 2026 Global Markets Review & Outlook2026-05-12
-
Macro Insights Why Global Small Cap2026-05-07
-
Market Analysis What to Think of Another Aussie Rate Hike2026-05-05
-
Market Analysis Europe’s Resilient Q1 GDP2026-05-01


Contact Us
Learn why 200,000 clients trust Fisher Investments and its affiliates to manage their money and find out how we may be able to help you achieve your financial goals.
As of 31/03/2026. Includes Fisher Investments and its affiliates.
New to Fisher? Call Us.
Contact Us Today