Personal Wealth Management / Economics
Early March Data Echo Equities’ Downturn
Preliminary March PMIs start showing what equity markets already signalled.
For the past five weeks, equity markets have been quickly pricing in the escalating likelihood of a global recession stemming from the world’s efforts to contain the spread of COVID-19. Now, courtesy of IHS Markit’s Flash March Purchasing Managers’ Indexes (PMIs) for major developed nations, we have the first economic data read on the situation. We agree with the financial world’s general verdict that the numbers are awful. In our view, that makes now a crucial time to remember equity markets typically lead economic data, not the other way around.
PMIs are surveys, conducted monthly, of thousands of private businesses. Each business reports whether activity rose, fell or held steady versus the prior month in a handful of categories—including output, new business, new export business, employment and supplier delivery times. They also report on more subjective indicators, including expectations for future business, and tangentially related issues such as prices. IHS Markit then compiles all the responses into headline indicators for manufacturing, services and a composite of all businesses. Readings correspond to the percentage of businesses reporting expansion, with results over 50 generally signalling economic growth and under 50 implying contraction, according to the surveys’ methodology. These aren’t perfect indicators, in our view, as they don’t measure the magnitude of that growth or contraction. But they are timely, and the flash readings—early tallies containing about 85% of responses for the month—are especially so. Hence, we find them quite useful.
With that explainer out of the way, Exhibit 1 displays this month’s flash PMIs. We encourage readers to take a deep breath before looking.
Exhibit 1: March Flash PMIs
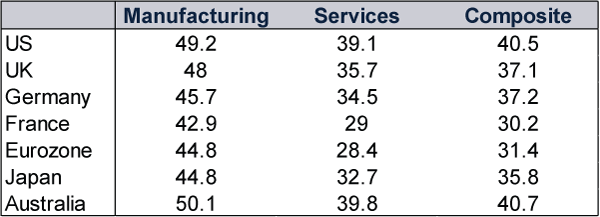
Source: IHS Markit, as of 24/3/2020.
If we were to put these numbers into recent and historical context, there would be a lot of “all-time low” and “biggest single-month drop ever.” But at this juncture, we doubt an extended discussion of this would do anyone any favours.
Instead, we offer some caveats about those manufacturing numbers, which look surprisingly resilient. Unfortunately, they are actually worse than they appear, as IHS Markit’s press releases showed they received a boost from skyrocketing supplier delivery times. This category counts as a positive because in a healthy expansion, supply chain backlogs indicate demand is robust and factories will have to increase production to keep up. In this case, however, they indicate the extent to which COVID-19 containment efforts have disrupted global supply chains. It is a false positive. Manufacturing output indexes, which eliminate that skew, were far worse across the board. In their accompanying commentary, IHS Markit also noted worldwide plunges in new orders, which we consider the main forward-looking component of a PMI as today’s orders generally become tomorrow’s production. At the very least, we suspect that points to disappointing output in April even if containment efforts begin letting up.
One other caveat: Even if April’s figures jump back up to 50, it doesn’t necessarily imply a recovery. Rather, we think it would simply mean businesses held steady at a very low level of activity. Even in what many would consider the best-case scenario of quarantines outside the worst COVID-19 hot spots easing in a week, we think it may take time for businesses to pick up the pieces and find some semblance of normalcy. In other words, whilst we do think COVID-19 containment is causing a lot of pent-up demand, it probably won’t unleash all at once. If containment efforts last several more weeks—or even months—then these numbers could get a lot worse. Particularly since the most extreme containment measures didn’t take effect until later in March.
We say all of this not to promote gloom, but to help you set realistic expectations, lest a few more rounds of bad data make you question a long-term investment strategy designed to meet your needs over many years, if not decades. Bull markets have always followed bear markets, and recoveries followed recessions.[i] Typically, bull markets have begun before the economic recovery, as equities began signalling the likelihood of a turnaround well before it became apparent in the data. For example, in March 2009, financial news commentators were talking about another Great Depression, much as they are now. Economic indicators were still hemorrhaging. So were corporate earnings. But equities began recovering, because they didn’t need good news.[ii] In our view, all they needed was a reality that wasn’t quite as bad as the world feared.
What was true then should likely be true now, in our view. (After all, equity markets’ steep drop began before any data hinted at COVID-related economic weakness—much as we would think likely.) Yet we also think it is impossible to time any bear market’s ultimate end. So we view this as a time to exercise the greatest, most difficult virtues in long-term investing: patience, endurance and faith that capital markets will work as they always have, ultimately overcoming even history’s greatest challenges.
[i] Source: FactSet, as of 24/3/2020. Statement based on MSCI World Index returns with net dividends.
[ii] Ibid.
Get a weekly roundup of our market insights.
Sign up for our weekly e-mail newsletter.

You Imagine Your Future. We Help You Get There.
Are you ready to start your journey to a better financial future?

Markets Are Always Changing—What Can You Do About It?
Get tips for enhancing your strategy, advice for buying and selling and see where we think the market is headed next.
Related Resources
-
Macro Insights Q1 2026 Global Markets Review & Outlook2026-05-12
-
Macro Insights Why Global Small Cap2026-05-07
-
Market Analysis What to Think of Another Aussie Rate Hike2026-05-05
-
Market Analysis Europe’s Resilient Q1 GDP2026-05-01


Contact Us
Learn why 200,000 clients trust Fisher Investments and its affiliates to manage their money and find out how we may be able to help you achieve your financial goals.
As of 31/03/2026. Includes Fisher Investments and its affiliates.
New to Fisher? Call Us.
Contact Us Today