Personal Wealth Management / Economics
Explaining the UK’s Worst-in-the-World Q2 Contraction
Monthly figures offer a more nuanced view, in our opinion.
UK gross domestic product (GDP, a government-produced estimate of economic output) fell -20.4% q/q in Q2, which is not only the worst contraction in the country’s history, but also the worst of the major Western nations reporting thus far.[i] That is the headline news you may have seen in your Internet travels. What lies under the surface is rather more interesting, though, in our view. Because the UK reports monthly GDP as well as quarterly, we have more granular results to show how the timing of the country’s gradual reopening affected GDP, which we think can help set expectations for what comes next. Although we think equity markets are likely looking way beyond 2020 economic data, getting a sense of how growth is occurring can help you stay cool in the face of dire headlines.
Exhibit 1 shows the scorecard of major developed nations’ Q2 GDP reports. Japan, Australia and Canada haven’t yet reported, but we think it seems unlikely any will take the dubious distinction as worst of the lot away from Britain, which was relatively more locked down during Q2 than the others. Once again, we show both quarter-over-quarter and annualised results for all countries, in order to make comparison easier. We did this because whilst European nations report quarter-over-quarter numbers primarily, the US’s flagship statistic is the annualised growth rate, which is the rate at which GDP would grow over an entire year if the quarter-over-quarter rate repeated in all four quarters. Displaying both figures makes it easier to spot trends and differences, in our view.
Exhibit 1: The Q2 GDP Scorecard
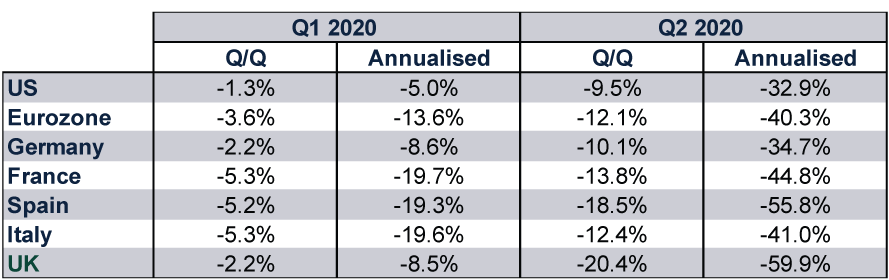
Source: FactSet, as of 12/8/2020.
The most striking aspect of the UK’s dismal result, in our view, is the fact that on a month-over-month basis, GDP growth in May and June was positive. After falling -6.9% m/m in March and -20.0% in April, GDP rose 2.4% m/m in May and 8.7% in June.[ii] In other words, the huge Q2 contraction—skewed by a horrible April—masked a nascent spring rebound.
The UK’s economic composition and lockdown timing explain most of this, in our view. The country didn’t lock down until 23 March—the last major Western nation to do so. Restrictions started easing in May, but at a glacial pace. Factories were the first to get the green light, in the middle of that month, with new social distancing protocols. But because manufacturing was only around 15% of UK GDP during pre-COVID times, reopening factories apparently did little more than help output stabilise in May.[iii]
The vast majority of UK economic activity—80% or so before COVID—is services.[iv] That includes retail, hospitality, financial services and personal care (including hair salons and the beauty industry), just to name a few. The service sector didn’t begin reopening until 15 June, when non-essential retailers got the green light. Pubs, restaurants and hair salons returned on 4 July, followed by the beauty industry on 15 July. The later reopening of the non-retail service sector had a rather large impact on June’s results: Whilst retail services output jumped 27.0% m/m, the broader service sector clawed back just 7.7%.[v] That was far behind manufacturing (11.0% m/m) and construction (23.5%).[vi]
To complicate matters further, the timeline above applied to England only. Northern Ireland’s timeline largely echoed England’s, with some businesses even opening a few days sooner. But Wales and Scotland were much more hesitant. In Scotland, non-essential retailers didn’t reopen until 29 June. Hair salons, restaurants, pubs and childcare centers didn’t get the go-ahead until 15 July. As for Wales, retailers reopened on 22 June, followed by restaurants, pubs and hairdressers on 13 July.
With this timeline in place—and with only Leicester and the greater Manchester area dealing with renewed restrictions—a big July services rebound wouldn’t surprise us. Nor would a Q3 rebound that dwarfs Continental Europe, where restrictions started easing weeks earlier, although we aren’t in the business of making precise GDP forecasts. Nor do we think GDP is at all likely to be back at breakeven by September’s end, but we suspect the country will look like much less of an outlier by then.
Although this is all interesting from a global economic forecasting standpoint, we don’t think it is terribly meaningful for UK shares at this juncture. Whilst US shares are flirting with record highs, UK markets are only about halfway back from the low—much like the rest of Europe.[vii] We think this is primarily a function of market composition. Tech and Tech-like growth shares (meaning, companies that reinvest relatively more of their profits into growth-orientated endeavours and have relatively higher valuation metrics such as price-to-earnings ratios) are leading this bull market higher. The UK has a strong bent toward Financials, Materials and Energy—all classic value plays (meaning, shares that are widely seen as undervalued and usually return more of their profits to shareholders via dividends rather than investing in new growth). That bias probably weighs on the UK and Europe unless and until a genuine sector or style leadership shift takes hold, and we don’t see any factors supporting that materialising in the foreseeable future. Not with credit market fundamentals likely weighing on banks’ profit margins as well as credit available for value-orientated companies, which tend to carry lower credit ratings. We don’t think global investors benefit from avoiding these areas, as that would impede diversification, but we think it is wisest to focus on the largest, more growth-orientated companies, with value exposure serving to diversify and avoid overconcentration.
[i] Source: FactSet, as of 12/8/2020.
[ii] Source: UK Office for National Statistics, as of 12/8/2020.
[iii] Ibid.
[iv] Ibid.
[v] Ibid.
[vi] Ibid.
[vii] Source: FactSet, as of 12/8/2020. Statement based on S&P 500, MSCI UK Investible Market Index and MSCI Europe Index returns including dividends.
Get a weekly roundup of our market insights.
Sign up for our weekly e-mail newsletter.

You Imagine Your Future. We Help You Get There.
Are you ready to start your journey to a better financial future?

Markets Are Always Changing—What Can You Do About It?
Get tips for enhancing your strategy, advice for buying and selling and see where we think the market is headed next.
Related Resources
-
Economics Pain at the Petrol Station Won’t Hurt the Global Economy2026-03-11
-
Environmental, Social and Governance Insights Responsible Investment Newsletter 20262026-03-11
-
Market Analysis February’s Growthy Data—and the Iran War’s Souring Sentiment2026-03-06
-
Market Analysis Putting the Latest Private Credit Implosion in Perspective2026-03-06


Contact Us
Learn why 195,000 clients trust Fisher Investments and its affiliates to manage their money and find out how we may be able to help you achieve your financial goals.
As of 31/12/2025. Includes Fisher Investments and its affiliates.
New to Fisher? Call Us.
Contact Us Today