Personal Wealth Management / Market Analysis
How Predictive Are Dow Transport Stocks?
Not very, in our view.
Does America’s Dow Jones Transportation Average (DJTA) know something broader markets don’t? According to some commentators we follow, it holds special magic, foretelling future broad market moves. But there is nothing special about transport-based gauges, in our view. We think stocks are stocks, and none are smarter than another set.
The DJTA consists of 20 stocks and, like its more famous 30-stock sibling, the Dow Jones Industrial Average (DJIA), is price-weighted.[i] We think this, plus the index’s including just a narrow sliver of the broader stock market, limits its usefulness. Price weighting means a member’s share price determines its weight in the index. But this is arbitrary, in our view. In a price-weighted index, a hypothetical stock ABC worth £100 with only 2 shares outstanding would have 10 times the influence of an imaginary £10 stock XYZ with 200 shares outstanding, even though the latter’s market capitalisation (stock price times number of shares outstanding) is 10 times bigger. Weighting stocks by alphabetical order makes about as much sense to us. That is why the market capitalisation-weighted FTSE 100 replaced the price-weighted FT 30 in 1984.[ii] The only good (historical) reason to price weight is easier calculation, in our view, but with the advent of computers, that ship sailed long ago. Still, Dow Averages’ quirky legacy carries on.[iii]
We think transportation’s market relevance is similarly overstated. Early in the Industrial Age, when railroad tycoons strode the earth, its economic might wasn’t questioned.[iv] In our view, transportation (and logistical) infrastructure remain important today—food and energy are, too; some of our favourite things! But as a percentage of the MSCI World Index’s market capitalisation, for example, Transportation is 2%—there are much more economically important sectors nowadays.[v] Despite the Dow Transports’ aura of historical importance, we think it is a mistake to overrate it, much less follow the alleged signals it sends about the American economy and stocks generally.
Two weeks ago, commentators we follow proclaimed the DJTA’s outperformance for the year at that point was an all-clear signal. Year to date through 29 March, in USD, the DJTA was up 1.5%, beating DJIA’s -2.9% and S&P 500’s -2.8%.[vi] Supposedly, this was “a sign of optimism about the economy’s strength that could fuel a broader market rally.”[vii] Now, we think the US economy is on firm footing and in much better health than most commentators we follow seem to appreciate. As that dawns on investors, we think the positive surprise is likely to be a relief that extends the bull market (a long period of generally rising stocks). But Transportation stocks weren’t a good indication of that, in our view.
Consider: Since 29 March, the DJTA has plunged -11.2% in USD.[viii] Some commentators we have read warned its falling over -20% from its 2 November intraday peak is a signal for recession (a broad-based decline in economic activity).[ix] For context, we should note that the DJTA was extremely volatile on 2 November owing to wild, speculative trading around one of its components, a rental car company, which happened to catch the fancy of the meme stock trading horde that day.[x] Making any broad conclusion from an anomalous one-off swing seems exceedingly tenuous to us. Nevertheless, those treating the DJTA as a bellwether now argue the gauge’s drop is bearish for broader markets—where Transports go, they argue, Industrials and other sectors will follow.[xi]
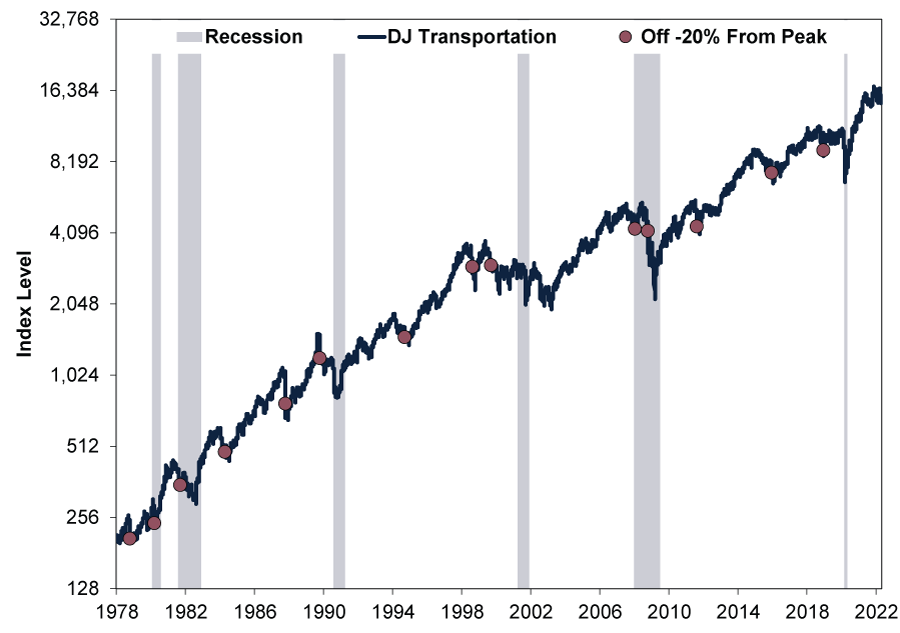
Our historical research disagrees with this notion, though. Exhibit 1 shows the DJTA’s spotty record of flagging recessions. Using daily data, DJTA declines of -20% in USD from prior peaks haven’t proven very predictive. Being generous, it has called 14 of the last 6 recessions, according to our analysis. Only two look well-timed to us. Others, like December 2018’s, came much too far in advance of a recession, in our view. COVID and the lockdowns that drove 2020’s recession were over a year away.[xii]
Exhibit 1: DJTA’s Poor Recession-Calling Record
Source: FactSet, as of 14/4/2022. DJTA, presented in USD, 31/12/1977 – 13/4/2022. Currency fluctuations between the dollar and pound may result in higher or lower investment returns.
Likewise for bear markets (typically prolonged, fundamentally driven declines exceeding -20%), the DJTA has called two of the last six beforehand. (Exhibit 2) There have been many more false (eight) and late (four) warnings than timely ones, based on our research.
Exhibit 2: DJTA’s Poor Bear Market-Calling Record
Source: FactSet, as of 14/4/2022. DJTA, presented in USD, 31/12/1977 – 13/4/2022. Currency fluctuations between the dollar and pound may result in higher or lower investment returns.

To be clear, the stock market is a good leading economic indicator, in our view. We just think that a narrow and poorly constructed gauge like the DJTA is, contrary to recent theories, less useful than a broad one. At best, we think the DJTA may give some indication of how the transport sector is faring, but that is about it. In our view, the US economy is far more services-based today, with increasing shares of it conducted electronically, for the DJTA to reflect America’s economic outlook as a whole.
More importantly for investors, though, we think stocks can’t say anything about stocks. One segment of the market doesn’t have any more privileged knowledge or foresight than another, in our view. Our research shows markets price in all widely available information simultaneously—different sectors and stocks just react differently to it. Ultimately, whatever the gauge, we think the key thing to remember is that past performance never predicts—taking one group of stocks out of context and shrouding it with unearned importance doesn’t change that.
[i] Source: S&P Dow Jones Indices, as of 14/4/2022. Dow Jones Averages methodology, April 2022.
[ii] “FTSE 100 Index – 30 Years Old Today,” Staff, The Harriman Stock Market Almanac, 3/1/2014.
[iii] See note i.
[iv] “Dow Jones Transportation Average,” Staff, Street Authority, 6/2/2009. Accessed via the Internet Archive.
[v] Source: FactSet, as of 14/4/2022. MSCI World Transportation group weight, 13/4/2022.
[vi] Ibid. DJTA, DJIA and S&P 500 price indexes presented in USD, 31/12/2021 – 29/3/2022. Currency fluctuations between the dollar and pound may result in higher or lower investment returns.
[vii] “Transport Stocks Are Flashing Bullish Signals for Broader Market,” Karen Langley, The Wall Street Journal, 28/3/2022. Accessed via the Internet Archive.
[viii] Source: FactSet, as of 14/4/2022. DJTA price index, 29/3/2022 – 13/4/2022. Presented in USD. Currency fluctuations between the dollar and pound may result in higher or lower investment returns.
[ix] Ibid. DJTA price index, 2/11/2022 – 13/4/2022. Presented in USD. Currency fluctuations between the dollar and pound may result in higher or lower investment returns. “A 100-Year Old Stock Market Indicator Has Tumbled Into a Bear Market, Sending a Warning Sign for the Economy,” Hamza Fareed Malik, Markets Insider, 7/4/2022.
[x] “Avis Shares Mysteriously Double in Value Then Tank, but Don’t Blame Reddit This Time,” Chris Morris, Fortune, 2/11/2021.
[xi] See note ix.
[xii] “Covid-19: Milestones of the Global Pandemic,” Staff, BBC, 29/9/2020.
Get a weekly roundup of our market insights.
Sign up for our weekly e-mail newsletter.

You Imagine Your Future. We Help You Get There.
Are you ready to start your journey to a better financial future?

Markets Are Always Changing—What Can You Do About It?
Get tips for enhancing your strategy, advice for buying and selling and see where we think the market is headed next.
Related Resources
-
In The News Bourse : pourquoi l’impact de la guerre en Iran sera moins important que prévu – par Ken Fisher2026-04-01
-
Market Volatility What the Latest Global Flash PMIs Reveal2026-03-31
-
Market Analysis Will Lower Capital Requirements Send Banks Higher?2026-03-31
-
Politics This Week in Gridlock: Europe Edition2026-03-27


Contact Us
Learn why 195,000 clients trust Fisher Investments and its affiliates to manage their money and find out how we may be able to help you achieve your financial goals.
As of 31/12/2025. Includes Fisher Investments and its affiliates.
New to Fisher? Call Us.
Contact Us Today