Personal Wealth Management / Market Analysis
How to Make Sense of the Latest Wage and Savings Data
Although there is mounting evidence inflation did squeeze some households last year, data show it didn’t derail growth or consumer spending.
With full-year savings and spending data for 2017 now in the books, thanks to the Office for National Statistics’ latest report, it seems fair to say the results are mixed. Consumer spending rose, but only 1.7% from 2016, its slowest rise since 2011.[i] The household savings rate eased to 4.9%, the lowest on record.[ii] Meanwhile, the BoE reported a £1.6 billion rise in consumer credit in February, causing the year-over-year growth rate to inch up to 9.4% from January’s 9.3%.[iii] Yet the week prior, ONS data showed inflation slowing to 2.7% y/y in February and January wage growth improving to 2.6% y/y—2.8% including bonuses.[iv] That revelation was enough to keep media reactions to the falling savings rate fairly calm, with coverage portraying January and February as a potential inflection point for household finances. Whilst this improvement in sentiment is noteworthy, we have long believed investors were too pessimistic about the macroeconomic impact of last year’s higher inflation. With media coverage still broadly portraying last year’s consumer spending rise as a product of rising debt and plunging savings, we think there is considerable room for sentiment to catch up to reality—a force we believe should benefit UK shares over the period ahead.
We don’t mean to diminish the hardship some families might have faced over the past year. For those whose incomes didn’t keep up with faster inflation, higher prices probably did pinch. Similarly, as more employers start factoring higher prices into their pay increases, many households are likely feeling some relief. As an economic risk, however, we don’t think negative real wages were ever as dangerous as headlines frequently made them out to be. Falling real wages can squeeze consumers, but we don’t believe this means they automatically prevent consumer spending from growing.
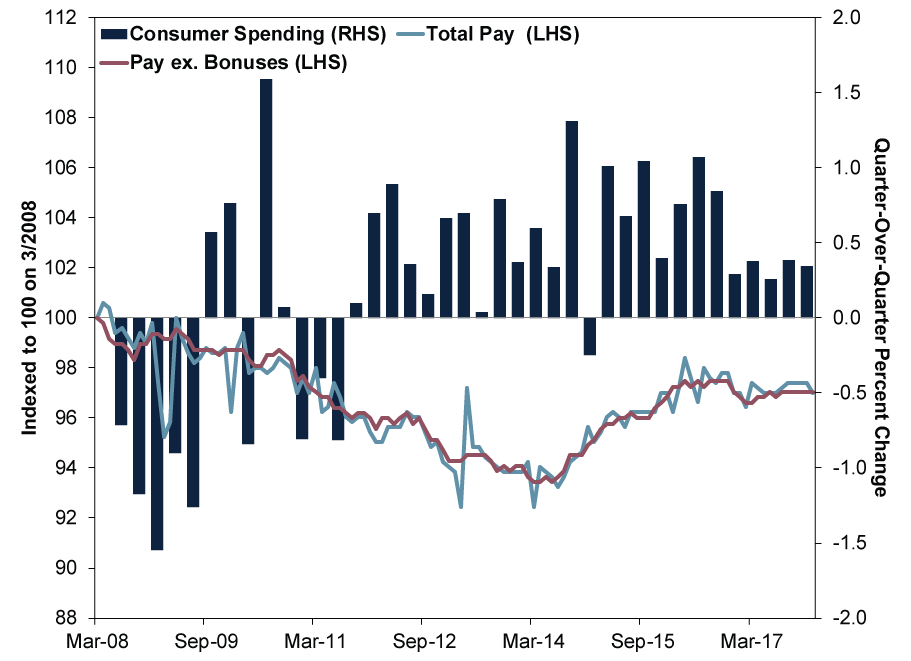
To see this, consider longer-term trends. Average weekly total earnings of UK employees before tax and other deductions, adjusted for inflation—what people frequently shorthand as “real wages”—remain 6.5% below their March 2008 peak.[v] Yet quarterly consumer spending, also adjusted for inflation, has risen 9.1% over the same period.[vi] Exhibit 1 shows real wages (both including and excluding bonus pay) and consumer spending over this entire stretch. Even as real wages fell for a long spell during this economic expansion’s first five years, consumer spending grew. Whilst it bounced around during the first couple years, consumer spending growth turned consistently positive in late 2011—over two years before real wages started their recovery.
Exhibit 1: Real Wages Fall, Brits Spend Anyway
Source: Office for National Statistics, as of 23/3/2018. Household final consumption expenditures, Q2 2008 – Q4 2017; real average weekly earnings including bonuses and real average weekly earnings ex. bonuses, March 2008 – January 2018.
Some media reports argue negative real wages forced UK consumers to borrow to finance spending, implying a house of cards soon to tumble. But this claim doesn’t totally withstand scrutiny , in our view. Excluding student loans, UK consumer debt is a touch below its September 2008 peak.[vii] Yes, it is up about £50 billion over the last five-ish years, but UK consumers buy over £300 billion pounds worth of goods and services each quarter.[viii] We question whether debt alone can explain this—to us, it seems like UK households might have been a lot more resilient than they got credit for. Perhaps that is because, as research from the US Federal Reserve suggests, average wage figures might not be the most accurate look at how individuals are faring since they ignore changes in the workforce. Note also, that even as the savings rate diminished last year, it didn’t turn negative. It doesn’t appear fair to say people financed spending by dipping into their accumulated savings.
We aren’t saying inflation had no impact. Household spending growth did slow whilst inflation was higher, averaging 0.35% q/q last year compared to 0.75% and 0.78% in 2016 and 2015, respectively.[ix] Retail sales got choppier, too: Although monthly retail sales held up well when measured in pounds, in volume terms, they struggled.[x] Consumers weren’t getting as much bang for their buck, and retailers likely felt the pressure as well, judging from several High Street retailers’ recent comments. However, given slowing lending and money supply growth and a relatively flat yield curve, we believe inflation should moderate further this year, easing this pressure.
Rather than getting hung up on backward-looking narratives, we see a better way for investors to assess the latest data. It appears many people had a false fear and now believe it is fading. Although this may have brought a touch of cheer, it suggests to us many investors generally see UK growth as precarious. In our observation, this has been the case ever since the Brexit referendum—but we don’t believe the fear is any more valid today. As people gradually realise UK consumers were better off than thought—and likely remain so—the gap between reality and sentiment probably narrows, supporting equities’ rise.
[i] Source: Office for National Statistics, as of 29/3/2018.
[ii] Ibid.
[iii] Source: Bank of England, as of 29/3/2018.
[iv] Source: Office for National Statistics, as of 23/3/2018.
[v] Ibid.
[vi] Ibid.
[vii] Source: Bank of England, as of 23/3/2018. Monthly amounts outstanding of total sterling consumer credit lending to individuals, ex. loans issued by the Student Loans Company, 31/1/2008 – 31/1/2018.
[viii] See notes i and vii.
[ix] Source: Office for National Statistics, as of 23/3/2018. Quarter-over-quarter growth in household final consumption expenditures, Q1 2016 – Q4 2017.
[x] Source: Office for National Statistics, as of 28/3/2018. UK retail sales volumes and values, January 2017 – February 2018.
Get a weekly roundup of our market insights.
Sign up for our weekly e-mail newsletter.

You Imagine Your Future. We Help You Get There.
Are you ready to start your journey to a better financial future?

Markets Are Always Changing—What Can You Do About It?
Get tips for enhancing your strategy, advice for buying and selling and see where we think the market is headed next.
Related Resources
-
Market Volatility What the Latest Global Flash PMIs Reveal2026-03-31
-
Market Analysis Will Lower Capital Requirements Send Banks Higher?2026-03-31
-
Politics This Week in Gridlock: Europe Edition2026-03-27
-
In The News Predictions of an AI dystopia are the height of arrogance2026-03-23


Contact Us
Learn why 195,000 clients trust Fisher Investments and its affiliates to manage their money and find out how we may be able to help you achieve your financial goals.
As of 31/12/2025. Includes Fisher Investments and its affiliates.
New to Fisher? Call Us.
Contact Us Today