Personal Wealth Management / Financial Planning
How to Think About Bonds’ Rocky Q1
In our view, it doesn’t mean their portfolio role is obsolete.
In Q1, UK bonds, as represented by the ICE BofA Sterling Broad Market Index, fell -7.1%—exceeding the MSCI World Index’s -2.4% decline.[i] Seeing this, some investors with blended fixed-income and equity asset allocations may question the logic of owning bonds. If they fall more than stocks in a volatile market, what is the point? But in our view, this conflates volatility and negativity, which aren’t synonymous. We don’t think occasional wobbles negate bonds’ usefulness for investors whose goals, needs and risk tolerance make holding some bonds to dampen portfolio swings worthwhile.
Bonds may dip (or spike), but they typically do so to a smaller degree than stocks.[ii] Take the current situation. Without context, bonds’ adding to stocks’ Q1 negativity may look less than beneficial. But consider a more granular view. Whilst bonds didn’t move opposite stocks in Q1, our historical research shows that isn’t unusual—the two aren’t really negatively correlated in any substantive way (meaning, they don’t move in opposite directions at a significant frequency). The degree of movement is telling, in our view, though. During the quarter, stocks fell as much as -10.4% year to date on 8 March.[iii] On that day, bonds were down -5.6% year to date.[iv] At their worst in Q1, 22 March, bonds were off -8.2% on the year—still less than stocks’ worst.[v] That means the margin of swings is smaller—which we think is potentially beneficial if you are drawing cash flow.
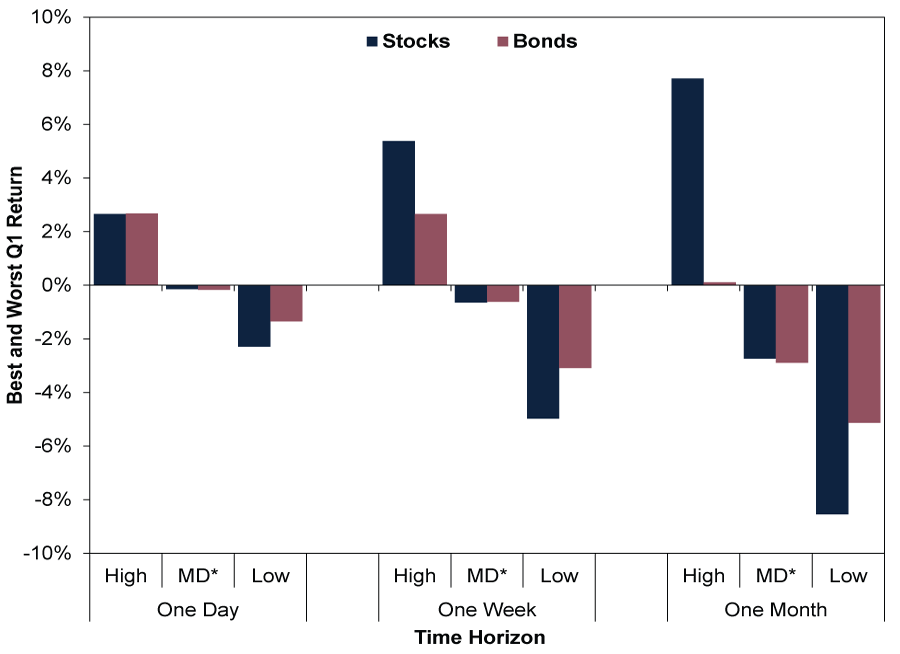
Look at this another way. Exhibit 1 shows stocks’ and bonds’ best, worst and median one-day, one-week and one-month returns last quarter. For example, stocks’ (in blue) best one-week return in Q1 was 5.4% and their worst was -5.0%, with a median one-day decline of -0.6%. Bonds’ (red) best one-week return was 2.7% and their worst -3.1%, with a median also at -0.6%. So investors whose goals, time horizon and cash flow needs are commensurate with a blended allocation are still seeing smaller gyrations on net.
Exhibit 1: Bonds Swung Less Than Stocks Last Quarter—and Dampened Portfolio Volatility
Source: FactSet, as of 7/4/2022. MSCI World Index with net dividends and ICE BofA Sterling Broad Market Index total returns, rolling 1-, 5- and 21-day trading periods, 31/12/2021 – 31/3/2022. *Median.
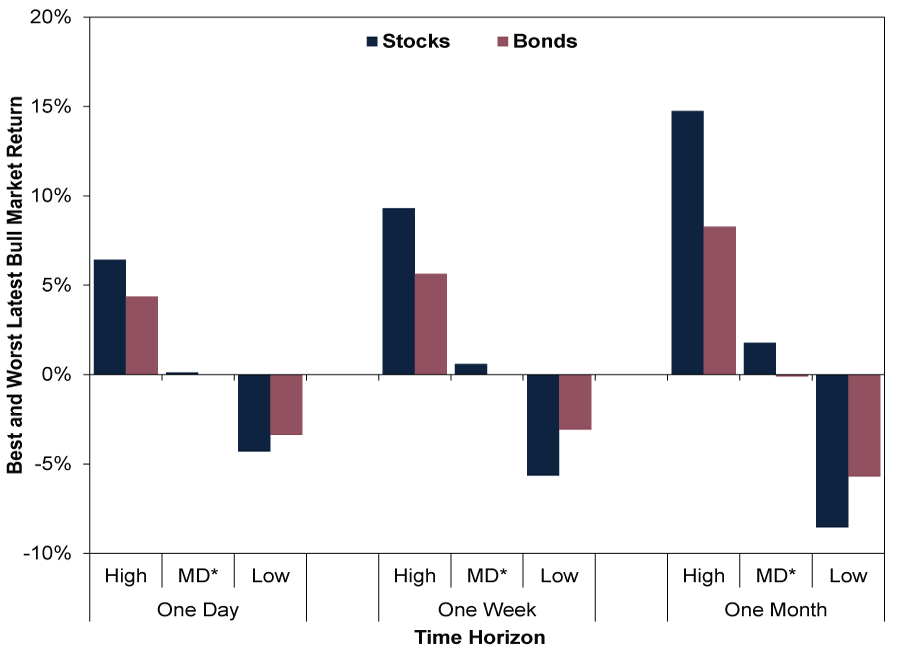
That was just for last quarter, but blended allocations over the entire current bull market (long period of generally rising stocks) so far, starting in mid-March 2020, exhibit the same general behaviour. (Exhibit 2) Sometimes stocks and bonds fall together—for a day, week, month or even quarter. But that doesn’t mean bonds aren’t doing the job we think they are meant to in blended allocations—moving less than stocks and dampening overall portfolio volatility.
Exhibit 2: Through the Bull Market So Far, Too
Source: FactSet, as of 7/4/2022. MSCI World Index with net dividends and ICE BofA Sterling Broad Market Index total returns, rolling 1-, 5- and 21-day trading periods, 16/3/2020 – 31/3/2022. *Median.
So whilst bonds can be volatile, they generally don’t swing as much in the short run as stocks do.[vi] Why? They have different drivers, in our view. Our research shows bonds move mainly on inflation and inflation expectations, as most make fixed payments over their maturities, and the value of their purchasing power fluctuates depending on investors’ perceptions of future inflation. (Inflation is defined as rising prices across the economy. We think perceptions of creditworthiness factor in as well depending on the individual issuer, of course, but not as much for the asset class as a whole.) Whilst perceived purchasing power erosion can evolve and shift, it usually doesn’t vary greatly, in our view, as it is just one variable and is also widely watched. By contrast, we think stocks move mostly on the forward-looking gap between the likely reality and current expectations already priced in for corporate profits—with a host of variables influencing that spread. But both asset classes can be subject to sentiment-driven swings, which seems to us largely what was at work in Q1.
For investors now, though, bonds’ having a negative quarter with stocks is all water under the bridge, in our view. What are markets likely to do going forward? When assessing bond positioning today, we suggest considering the inflation and interest rate outlook. We think upside pressure on rates probably peters out from here. Whilst recent energy and commodity driven price spikes may keep inflation elevated for longer than we thought previously, a further material up move from here doesn’t look very probable to us. We think those factors are simply too widely watched and likely already reflected in 10-year gilt yields’ rise from their August 2020 low of 0.1% to 1.7% now.[vii] Materially rising rates from current levels would probably take a new factor prolonging inflation more than investors presently expect, in our view. From a strictly market and economic perspective—being agnostic about political ramifications—we think businesses responding to price signals in the relatively near future is more likely to slow inflation than another shock is to accelerate it.
In our view, bonds’ recent volatility just argues for knowing—and managing—those risks in the overall context of your short, intermediate and long-term financial goals, as well as your risk tolerance.
[i] Source: FactSet, as of 7/4/2022. MSCI World Index with net dividends and ICE BofA Sterling Broad Market Index total returns, 31/12/2021 – 31/3/2022.
[ii] Source: FactSet and Intercontinental Exchange, Inc., as of 7/4/2022. Statement based on MSCI World Index with net dividends, 31/12/1969 – 31/3/2022, and ICE BofA Sterling Broad Market Index total returns, 31/12/1996 – 31/3/2022.
[iii] Source: FactSet, as of 7/4/2022. MSCI World Index with net dividends, 31/12/2021 – 8/3/2022.
[iv] Ibid. ICE BofA Sterling Broad Market Index total returns, 31/12/2021 – 8/3/2022.
[v] Ibid. ICE BofA Sterling Broad Market Index total returns, 31/12/2021 – 22/3/2022.
[vi] See note ii.
[vii] Ibid. 10-year gilt yield, 4/8/2020 – 6/4/2022.
Get a weekly roundup of our market insights.
Sign up for our weekly e-mail newsletter.

You Imagine Your Future. We Help You Get There.
Are you ready to start your journey to a better financial future?

Markets Are Always Changing—What Can You Do About It?
Get tips for enhancing your strategy, advice for buying and selling and see where we think the market is headed next.
Related Resources
-
Macro Insights Q1 2026 Global Markets Review & Outlook2026-05-12
-
Macro Insights Why Global Small Cap2026-05-07
-
Market Analysis What to Think of Another Aussie Rate Hike2026-05-05
-
Market Analysis Europe’s Resilient Q1 GDP2026-05-01


Contact Us
Learn why 200,000 clients trust Fisher Investments and its affiliates to manage their money and find out how we may be able to help you achieve your financial goals.
As of 31/03/2026. Includes Fisher Investments and its affiliates.
New to Fisher? Call Us.
Contact Us Today