Personal Wealth Management / Market Analysis
Lessons From Media's Confusion Over Mixed UK Jobs Data
Media banter over how the BoE may interpret Q4 2017’s mixed unemployment data show the folly of trying to forecast central bankers’ actions.
One of media’s chief pastimes in recent years—and particularly in recent weeks, given the hyper-focus on inflation—seems to be speculating about what central banks will do in light of economic data releases. So it was with joy that we relished the massive confusion in the press as it attempted to discern exactly what Britain’s latest Labour Force Survey meant for future BoE actions. Would the slight unemployment rate uptick delay hikes? Or would the higher-than-anticipated wage growth speed them? At times like this, it is worth remembering central banks’ actions cannot be forecast—they are people’s decisions, often biased and opinionated. Bankers decide which data to emphasise and which to downplay; which theories to operate on and which to ignore. In our opinion, the media fixation on what data mean for rate hikes is a sideshow for equity investors—one we hope you tune out.
First, the data. Britain’s unemployment rate ticked up 0.1 percentage point to 4.4% in Q4 2017—an unexpected increase, as economists forecast no change.[i] This is still a very low unemployment rate by historical standards, close to the early 1970s’ record lows. Nevertheless, some economists said this uptick should delay BoE rate hikes, noting it moves Britain’s economy away from the 4.25% unemployment rate the BoE says will spur wage-driven inflation. (More on that concept to come.)
Yet here is the thing: The unemployment rate isn’t simply the percentage of the population out of work. Rather, it is the percentage of unemployed people who sought a job in the previous four weeks. If they didn’t seek work, they aren’t included—these discouraged people fall out of the labour force. In Q4, the unemployment rise wasn’t driven by increasing slack in the labour market. It wasn’t due to firings, layoffs or anything of the sort. Actually, 88,000 more people finished Q4 2017 employed than at its outset.[ii] It’s just that 109,000 people rejoined the labour force. How, then, will the BoE see this uptick?
Similarly, many speculate higher-than-expected wage growth (2.5% y/y versus estimates of a second straight 2.4% reading) mean wage-driven inflation is coming closer.[iii] Yet this rate is still below CPI’s 3.0%, meaning on a real basis, wage gains are negative.[iv] Moreover, whether one sees a tighter labour market forcing wages up from here may also hinge on their interpretation of the unemployment uptick. How will the BoE weigh that? Data throughout Wednesday’s report were in conflict, leading to disparate potential conclusions.
But at a higher level, there is an even better reason to look askance at employment data’s influence on BoE behaviour: Wages don’t drive inflation. To paraphrase Nobel-prizewinning economist Milton Friedman, inflation is always and everywhere a monetary phenomenon—too much money chasing too few goods. Money doesn’t refer to wages—after all, your employer pays you with funds already included in the money supply. Rather, it refers to the total amount of money sloshing around the system—including anything that reasonably functions as money, like commercial paper and loans. Unless economic output soars, a higher quantity of money changing hands more quickly will drive prices higher. It is simple supply and demand.
Wages are an after-effect of this. Friedman explained this quite nicely in a 1968 speech, in which he took on the popular theory of his day: a model called the Phillips Curve, which purported to link unemployment and inflation. Its namesake, William Phillips, theorised that low unemployment forced employers to hike wages and then raise prices to offset the added cost and preserve profit margins. Inflation! But there was a simple flaw in his logic, which Friedman pointed out: When employers compete for workers, they factor inflation into the wages they offer. Hence, at its heart, the Phillips Curve is a circular argument—inflation driving inflation, which makes little sense.[v] Think of the 1970s: If inflation and employment were linked, why did high unemployment and high inflation occur simultaneously?
We suspect the previous discussion isn’t lost on BoE officials. So why do they talk up the link between jobs, wages and inflation? Sorry, but we can’t say. Perhaps it’s politics. Perhaps they merely choose to overlook the aforementioned theory and evidence showing labour’s influence on prices is limited at best. As we said early on, BoE officials are people.
For all these reasons, we believe speculating on how the BoE will interpret this quarter’s employment data—or any economic data—is fruitless. You can’t know. The good thing is, historically, you haven’t needed to in our view. The BoE’s rate hike last year didn’t squash equities. Rate hikes in America also haven’t proven bearish since the Federal Reserve began this tightening cycle in 2015. These aren’t isolated incidents, either: Exhibit 1 plots every UK bank rate hike since 1970 (red circles) on the MSCI UK’s index level. (We used a logarithmic scale, which plots equal percentage moves equally in order to facilitate seeing the movement.) Sure, some occur during or near the beginning of bear markets. But vastly more do not. In our view, overhyping UK rate hikes is likely to prove unnecessary, making attempts to forecast the BoE irrelevant.
Exhibit 1: UK Bank Rate Hikes and the British Equities
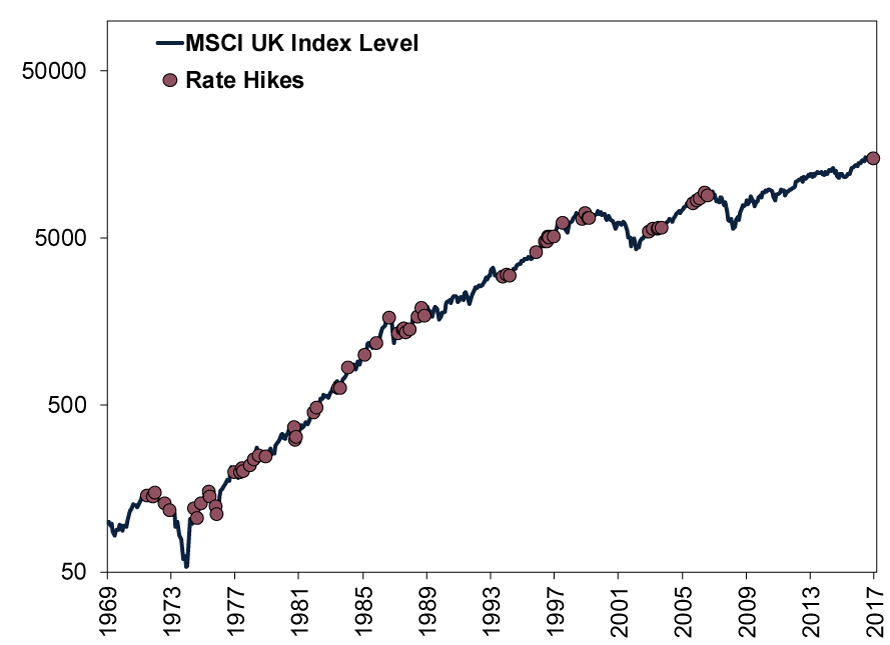
Source: FactSet, as of 21/2/2018. MSCI UK with gross dividends and the UK bank rate, December 1969 – January 2018.
[i] Source: Office for National Statistics, as of 21/2/2018.
[ii] Source: Office for National Statistics, as of 21/2/2018.
[iii] Ibid.
[iv] Source: FactSet, as of 21/2/2018. UK Consumer Price Index, year-over-year percentage change in December and January 2018.
[v] You can feel free to call it the Phillips Circle if you wish.
Get a weekly roundup of our market insights.
Sign up for our weekly e-mail newsletter.

You Imagine Your Future. We Help You Get There.
Are you ready to start your journey to a better financial future?

Markets Are Always Changing—What Can You Do About It?
Get tips for enhancing your strategy, advice for buying and selling and see where we think the market is headed next.
Related Resources
-
Market Volatility Some Timeless Counsel After March’s Volatility2026-04-07
-
Market Volatility What the Latest Global Flash PMIs Reveal2026-03-31
-
Market Analysis Will Lower Capital Requirements Send Banks Higher?2026-03-31
-
Politics This Week in Gridlock: Europe Edition2026-03-27


Contact Us
Learn why 200,000 clients trust Fisher Investments and its affiliates to manage their money and find out how we may be able to help you achieve your financial goals.
As of 31/03/2026. Includes Fisher Investments and its affiliates.
New to Fisher? Call Us.
Contact Us Today