Personal Wealth Management / Market Analysis
Major Nations’ Yield Curves Probably Aren’t Sending Warning Signals
The meaningful parts of major nations’ yield curves don’t seem at risk of inverting to us.
Yield curves, graphical depictions of one debt issuer’s interest rates across the spectrum of debt maturities, are flattening globally, particularly the spread between 10-year and 2-year yields.[i] That has commentators we follow warning of a worsening economic outlook—just as monetary policy institutions seem set to tighten policy. In their view, that flattening yield curve hints at an approaching, poisonous cocktail for this bull market (a long period of generally rising stocks). But we think there is a big problem with this: Our analysis shows the spreads those commentators point to, like the 10-year to 2-year or the 30-year to 20-year yield spreads, aren’t very relevant to growth, potentially leading investors to errant conclusions.[ii] Viewed properly, we think global yield curves reveal a far more benign explanation—and reality.
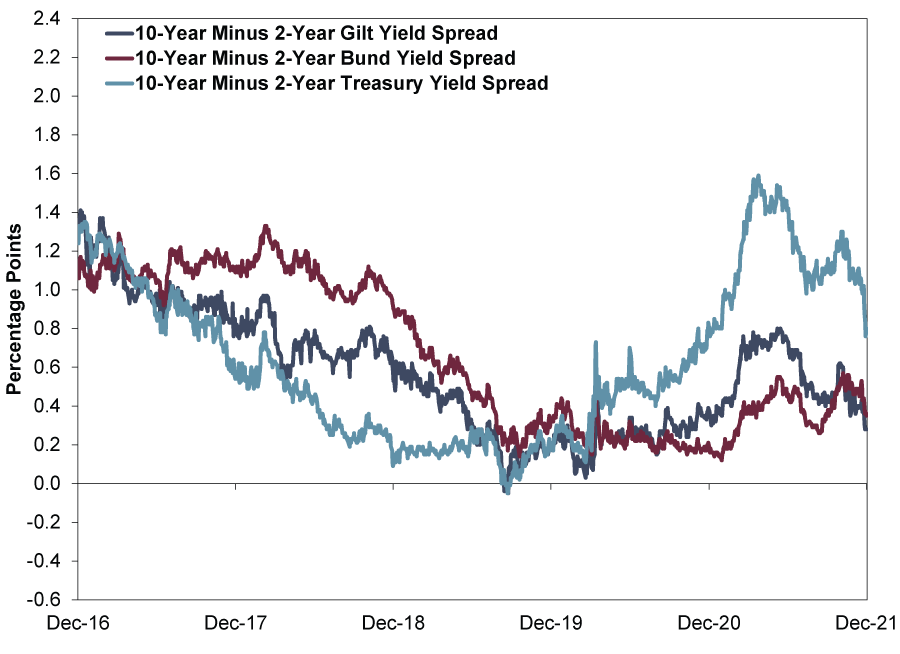
It is true 10-year yields have dropped in recent weeks, whilst 2-year yields have risen, compressing one measure of the yield curve spread. In the UK, the 10-year gilt yield fell from 1.01% in early October to 0.74%, and the 2-year yield edged up from 0.39% to 0.46%.[iii] Hence, this spread has narrowed from 0.62 percentage points in October to 0.28 now.[iv] Other major developed world bond markets have followed suit. As Exhibit 1 shows, Germany’s 10-year to 2-year bund yield spread shrank from 0.57 percentage points to 0.35 and the US Treasury’s from 1.30 to 0.80.
Exhibit 1: 10-Year to 2-Year Yield Curves
Source: FactSet, as of 7/12/2021. 10-year minus 2-year UK gilt, German bund and US Treasury yield spreads, 6/12/2016 – 6/12/2021.
Meanwhile, the 30-year US Treasury yield fell to 1.96% in late October, sliding ever so slightly below the 20-year’s 1.98%—an inversion, according to some commentators we follow.[v] It has inverted a bit more since, with the 30-year now at 1.80% versus the 20-year’s 1.88%.[vi] But 20-year Treasurys are relatively illiquid—they were reintroduced last year for the first time since 1986—so we wouldn’t read much of anything into this.[vii] Still, some commentators say the anomaly portends global yield curve flattening generally. Whilst we have seen a range of speculation in financial publications we follow about what underpins the flattening—from markets pre-pricing potential interest rate hikes on the short end of the curve to the prospect of slower future inflation on the long end—there appears to be a general consensus about what it means: slower growth, perhaps even economic contraction, ahead.[viii]
That is one way to interpret yield curve moves, as our research shows they tend to reflect future growth and inflation outlooks. But there is another, more direct—and, in our view, more correct—way to view them: as a monetary transmission mechanism.[ix] That is, the means by which monetary policy moves get transmitted to the broader economy. Banks borrow at short-term rates—think of your (likely miniscule) deposit rate—and lend at long-term rates, making the gap between the two their profit margin on new loans.[x] Flatter curves, therefore, reduce banks’ potential profits—which we think discourages them from extending credit, an economic headwind.[xi] But our research shows very few banks will borrow at 2-year rates to fund loans. Almost none would borrow at 20-year rates to do so, in our experience. They usually tap much shorter-term sources, so their funding costs are likely far closer to 3-month and overnight rates, based on our analysis. We think the spread between 10-year and 3-month rates better reflects banks’ potential loan profits—and incentive to lend.
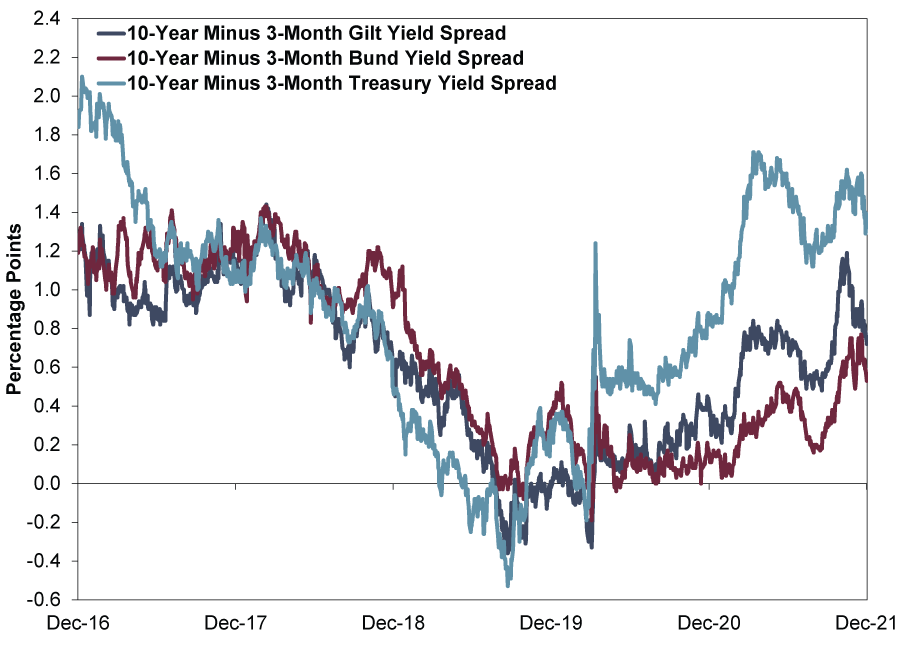
As Exhibit 2 shows, 10-year to 3-month yield spreads are wider. They have narrowed recently, but not alarmingly so, remaining closer to their highs for the year. 3-month gilt yields have hovered near 0% since March 2020, when the BoE cut the Bank Rate.[xii] So the yield curve’s latest squiggle down is due entirely to the 10-year yield’s dip, which we don’t think is really all that significant in the broad scheme of things—it is still wider than almost any point this year before October. The same goes for Germany and America. Germany’s 10-year to 3-month bund yield curve remains near its widest all year. America’s yield curve is near the middle of this year’s range.
Exhibit 2: 10-Year to 3-Month Yield Curves
Source: FactSet, as of 7/12/2021. 10-year minus 3-month UK gilt, German bund and US Treasury yield spread, 6/12/2016 – 6/12/2021.
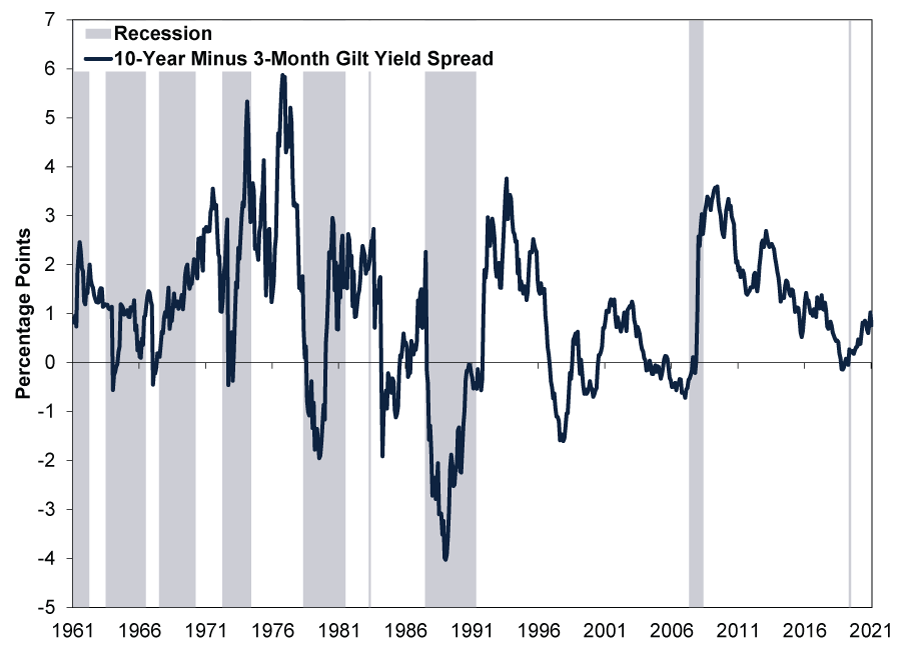
Now, according to our research, these yield spreads remain historically mediocre and well off levels that led to booming lending in the past—so we don’t foresee galloping loan growth from here. But the key, in our view, is that around current levels, they aren’t close to signalling recession (a broad-based decline in economic activity). Although it isn’t ironclad, we think Exhibit 3 shows lasting, fairly significant yield curve inversion is what generally precipitates a downturn. (Also note: We don’t think 2019’s modest inversion caused 2020’s 2-month recession, which was due entirely to COVID-related lockdowns. Actually, that inversion reversed well before COVID hit, as the chart shows.) In our view, the yield curve presently suggests ongoing, albeit pedestrian, expansion consistent with a return to pre-pandemic norms.
Exhibit 3: The Yield Curve and Recessions
Source: Federal Reserve Bank of St. Louis and FactSet, as of 7/12/2021. 10-year minus 3-month UK gilt yield spread, November 1961 – November 2021. UK recessions dates based on “An Examination of UK Business Cycle Fluctuations: 1871-1997,” Jagjit S. Chadha, Norbert Janssen and Charles Nolan, National Institute of Economic and Social Research, June 2000, “Every UK Recession to Have Taken Place in Modern History: From the Three-Day Week to the 2008 Crash and the Coronavirus Crisis,” Alex Lawson, Evening Standard, 12/8/2020, and peak-to-trough monthly GDP, January 1997 – September 2021.
Moderate growth is likely fine for stocks, in our view; they are able to rise without booming economic activity. We think modest progress with no recession on the horizon—which a moderately upward sloping yield curve, conceived correctly, points to—should be good enough.
[i] Source: FactSet, as of 7/12/2021. Statement based on 10-year minus 2-year UK gilt, German bund and US Treasury yield spreads, 2/1/2021 – 6/12/2021.
[ii] “Bond Market Flashes Warning Sign Over Global Economic Growth,” Tommy Stubbington and Kate Duguid, Financial Times, 2/12/2021. Accessed via 711Web.com. “Treasury Curve Inverts at Long-End as 20-Year Yield Tops 30-Year,” Elizabeth Stanton and Ye Xie, Bloomberg, 28/10/2021. Accessed via Yahoo!
[iii] Source: FactSet, as of 7/12/2021. 10-year and 2-year gilt yields, 4/10/2021 – 6/12/2021.
[iv] Ibid. 10-year minus 2-year gilt yield spread, 4/10/2021 – 6/12/2021.
[v] Ibid. 30-year and 20-year Treasury yields, 28/10/2021.
[vi] Ibid. 30-year and 20-year Treasury yields, 6/12/2021.
[vii] “How Liquid Is the New 20-Year Treasury Bond?” Michael Fleming and Francisco Ruela, Liberty Street Economics, 1/7/2020.
[viii] See note ii.
[ix] “The Importance of Bank Profitability and Bank Capital for Monetary Policy,” Staff, Deutsche Bundesbank, January 2018.
[x] “The Influence of Monetary Policy on Bank Profitability,” Claudio Borio, Leonardo Gambacorta and Boris Hofmann, Bank for International Settlements, October 2015.
[xi] “Simple Banking: Profitability and the Yield Curve,” Piergiorgio Alessandri and Benjamin Nelson, Bank of England, June 2012.
[xii] Source: Bank of England, as of 7/12/2021. Bank Rate, 11/3/2020 – 19/3/2020.
Get a weekly roundup of our market insights.
Sign up for our weekly e-mail newsletter.

You Imagine Your Future. We Help You Get There.
Are you ready to start your journey to a better financial future?

Markets Are Always Changing—What Can You Do About It?
Get tips for enhancing your strategy, advice for buying and selling and see where we think the market is headed next.
Related Resources
-
Macro Insights Q1 2026 Global Markets Review & Outlook2026-05-12
-
Macro Insights Why Global Small Cap2026-05-07
-
Market Analysis What to Think of Another Aussie Rate Hike2026-05-05
-
Market Analysis Europe’s Resilient Q1 GDP2026-05-01


Contact Us
Learn why 200,000 clients trust Fisher Investments and its affiliates to manage their money and find out how we may be able to help you achieve your financial goals.
As of 31/03/2026. Includes Fisher Investments and its affiliates.
New to Fisher? Call Us.
Contact Us Today