Personal Wealth Management / Market Analysis
Quick Hits on Inflation Pressures Outside the UK
Whilst the energy price cap continues distorting UK inflation data, pressures in the US and eurozone may be easing.
Last week, America and the eurozone announced a spate of price and jobs data—triggering plenty of analysis and discussion amongst commentators we follow about the implications for inflation (broadly rising prices across the economy) and future monetary policy. Here we round them up and highlight some tidbits we think are worth considering for global investors—after all, these areas together comprise about 78% of the global stock market.[i]
Energy’s Ongoing Impact on Eurozone Inflation
Eurozone inflation slowed for the first time since June 2021, hitting 10.0% y/y in November—below analysts’ consensus projections of 10.4% and down from October’s 10.6%.[ii] Amongst the main components, energy and services prices grew more slowly—easing from October’s 41.5% y/y to 34.9% and 4.3% to 4.2%, respectively—whilst the food, alcohol & tobacco category sped (from 13.1% to 13.6%).[iii] Core inflation (which excludes volatile energy, food, alcohol & tobacco prices) registered 5.0%, unchanged from October.[iv]
Many experts we follow posited the headline slowdown means eurozone inflation has peaked. That could be! But we caution investors against reading too much into one month of data, as trying to pinpoint exact inflection points is fruitless, in our view. Moreover, we think the eurozone faces some unique issues impacting inflation data. Even though oil prices have been overall falling since March, helping cool inflation in the US and elsewhere, that hasn’t been the case in the eurozone due to its reliance on natural gas. (Exhibit 1) Prices have been elevated on supply concerns as EU nations raced to fill reserves, and with the winter heating season approaching, those pressures will probably take more time to ease—though we suspect they eventually will. In the meantime, according to our analysis of the data, its fast rise is largely why headline prices are doubling the inflation rate in prices excluding energy, food and tobacco. (Exhibit 2)
Exhibit 1: Comparing Eurozone and US Energy Prices
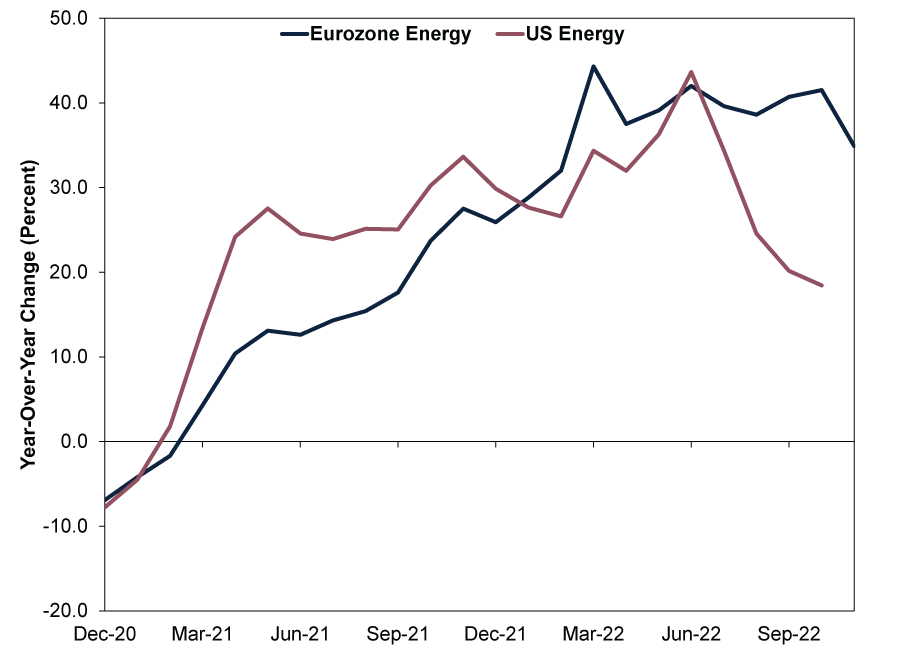
Source: FactSet, as of 5/12/2022. Eurozone Harmonised Index of Consumer Prices for Energy, December 2020 – November 2022 and US Personal Consumption Expenditure Energy Goods & Services Price Index, December 2020 – October 2022. Both indexes are government-produced measures tracking prices of commonly consumed goods and services.
Exhibit 2: Energy Drives the Gap in Eurozone Headline Inflation
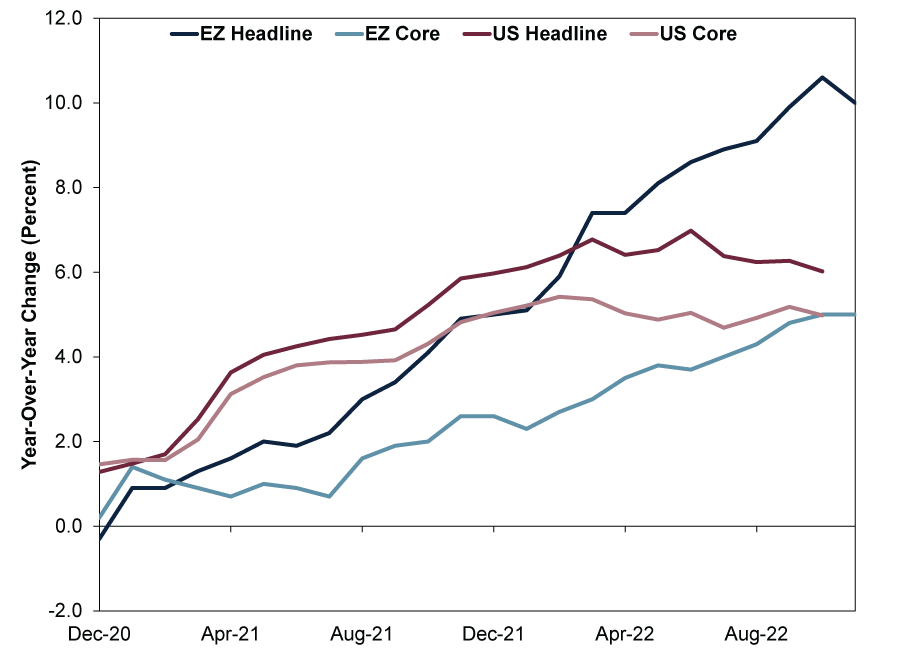
Source: FactSet, as of 7/12/2022. December 2020 – November 2022.
Americans Spend Even as Prices Rise
The US’s personal consumption expenditures (PCE) price index—the US Bureau of Economic Analysis’s headline price index and the US Federal Reserve’s (Fed) targeted inflation measure—ticked down to 6.0% y/y in October from September’s 6.3%, whilst core prices (which exclude food and energy) decelerated to 5.0% from 5.2%.[v] Looking under the bonnet, goods prices rose 7.2% y/y, decelerating from September’s 8.0%, whilst services prices ticked up to 5.4% from 5.3%.[vi] The former appears to be easing as supply chain bottlenecks work themselves out and producers increase supply in response to higher prices. But some commentators we follow warn rising services prices will offset the slowdown in goods prices as issues, including labour shortages, lead to higher costs for services industries. In our view, the rise in services prices reflects some pent-up demand tied to easing COVID measures and businesses’ getting back to normal operations. But just as goods prices have started easing as supply and demand came into better balance, we anticipate something similar will likely occur on the services side as businesses and workers adjust.
We think the US’s October PCE report also shed some light on a widespread concern amongst commentators we follow from this year: Will high prices crimp US consumers? Headlines from publications we monitor feature plenty of anecdotal evidence highlighting inflation’s toll on US households’ pocketbooks, and that is no doubt true for some, much as it is for many UK households. But overall spending has been resilient. Inflation-adjusted PCE rose 0.5% m/m, as consumption in goods and services each rose. (Exhibit 3)
Exhibit 3: Resilient US Consumer Spending
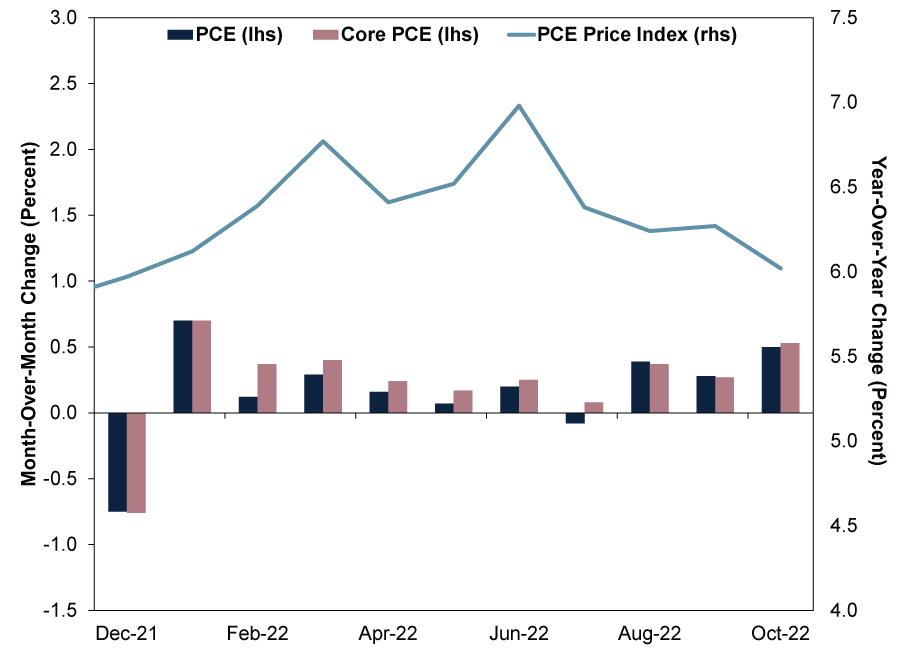
Source: FactSet, as of 5/12/2022. December 2021 – October 2022. Core PCE excludes food and fuel.
Even though prices have risen, US disposable incomes have also grown—a big reason, in our view, spending has remained resilient even as headline inflation has accelerated.[vii] As the US’s annual inflation rate moderates, monthly price increases will probably level off, too, which may be underway already. Consider: After averaging a monthly change of 0.5% from January 2021 – June 2022, the US’s PCE prices have been slowing, registering a 0.3% m/m rate in September and October—in line with the US’s long-term historical average of 0.3% from 1960 – 2019.[viii] In our view, US consumers can likely continue managing at that moderating rate, especially as businesses adjust wages and salaries for inflation—which our research shows usually happens at a lag.
What to Make of Hot US Wage Growth
Speaking of which, last Friday’s November US employment report showed nonfarm payrolls rose again, this time by 263,000, whilst the unemployment rate remained a historically low 3.7%.[ix] But the figure that generated most commentary in publications we follow: ongoing hot wage growth. Hourly earnings rose 0.6% m/m (5.1% y/y), its biggest gain since January.[x] Some observers worry this could herald a wage-price spiral, in which tight labour markets force employers to pay more to workers, boosting demand. They then pass on increased labour costs to consumers, stoking yet more inflation—lather, rinse, repeat. In turn, the Fed may decide to continue hiking interest rates, raising the risk of recession (a decline in broad economic output).
Now, there are many misperceptions with this line of thinking, in our view. For one, we don’t think Fed officials’ decisions are predictable—not to mention our research finds rate hikes don’t have any preset market or economic impact. But we also think the wage-price spiral is faulty logic. As Nobel laureate Milton Friedman taught in the 1960s, inflation drives wage growth, not the other way around.[xi] Wages are simply a price (in this case, of labour). As inflation rises, some workers may demand a raise to account for the loss of spending power. But whilst employers could pass on those pay increases to customers if they think market forces will allow it, they don’t have to. Companies may also adjust operations to offset their higher labour costs. Or, they could use their profit margins and absorb the hit on the expectation that future growth will make it up.
This isn’t just theory, as Exhibits 4 and 5 show. If higher wages are an inflation driver, theoretically, they should lead inflation measures—and that isn’t the case.
Exhibit 4: Wages Don’t Drive Inflation
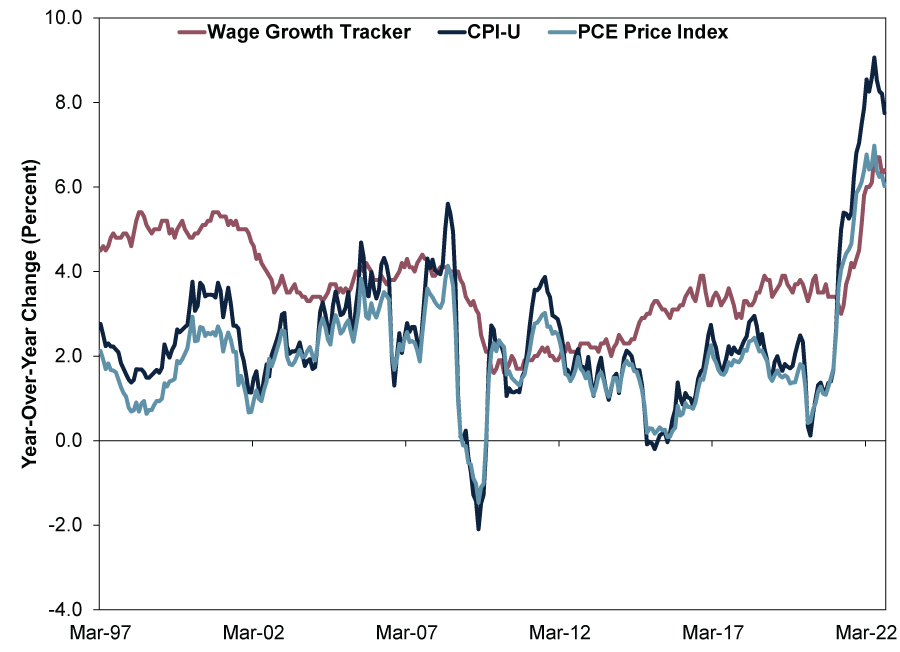
Source: FactSet and Federal Reserve Bank of Atlanta’s Wage Growth Tracker, as of 5/12/2022. CPI – All Items Index, PCE Price Index, and Atlanta Wage Growth Tracker, March 1997 – October 2022.
Exhibit 5: More Evidence Wages Don’t Drive Inflation
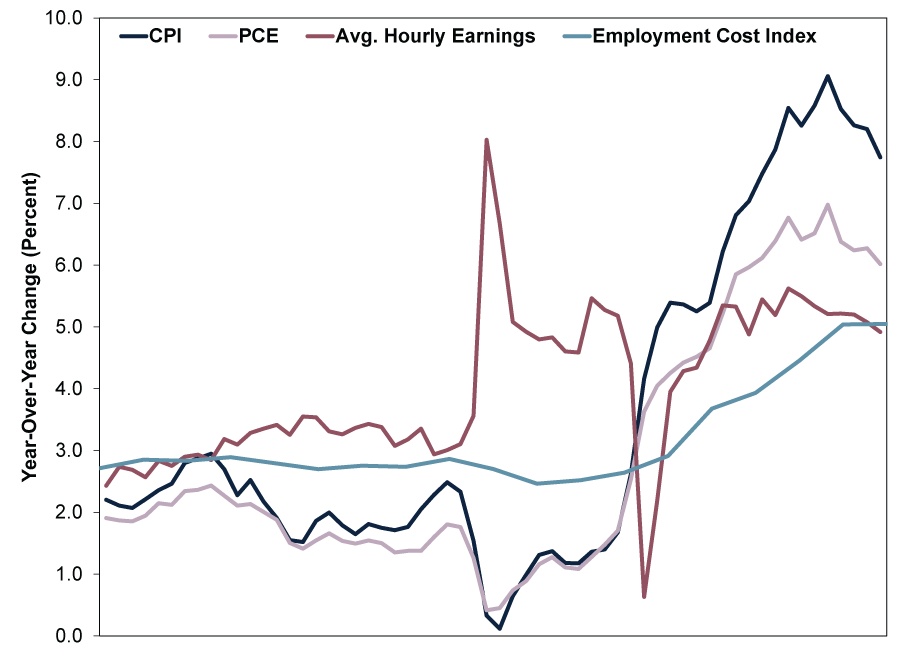
Source: St. Louis Federal Reserve, as of 2/12/2022. Consumer Price Index – All Items, Real PCE Price Index, Average Hourly Earnings of All Employees, November 2017 – October 2022 and Employment Cost Index: Total Compensation, Q3 2017 – Q2 2022.
[i] Source: FactSet, as of 9/12/2022. US, Austria, Belgium, Finland, Germany, France, Ireland, Italy, Netherlands, Portugal and Spain market capitalisation as a percentage of MSCI World Index market capitalisation on 9/12/2022. Market capitalisation is a measure of a firm or equity market’s size, calculated by multiplying share price times shares outstanding.
[ii] Source: FactSet, as of 5/12/2022.
[iii] Ibid.
[iv] Ibid.
[v] Ibid.
[vi] Ibid.
[vii] Source: St. Louis Federal Reserve, as of 7/12/2022. Statement based on real (inflation-adjusted) per-capita disposable personal income, monthly, January 2010 – October 2022.
[viii] See note ii. Statement based on PCE Price Index, month-over-month change, January 1960 – December 2019.
[ix] See note ii.
[x] Ibid.
[xi] “The Role of Monetary Policy,” Milton Friedman, The American Economic Review, Vol. LVIII, March 1968.
Get a weekly roundup of our market insights.
Sign up for our weekly e-mail newsletter.

You Imagine Your Future. We Help You Get There.
Are you ready to start your journey to a better financial future?

Markets Are Always Changing—What Can You Do About It?
Get tips for enhancing your strategy, advice for buying and selling and see where we think the market is headed next.
Related Resources
-
Politics Blunting Burnham?2026-07-22
-
Economics Don’t Doubt the Old World2026-07-17
-
In The News Thinking of investing in an IPO? Read my golden rule first2026-07-16
-
Politics Long-Term Forecasts and Court Verdicts: The Latest in British and French Politics2026-07-14


Contact Us
Learn why 210,000 clients trust Fisher Investments and its affiliates to manage their money and find out how we may be able to help you achieve your financial goals.
As of 30/06/2026. Includes Fisher Investments and its affiliates.
New to Fisher? Call Us.
Contact Us Today