Personal Wealth Management / Market Analysis
Reviewing the Latest Data Out of America, China and Japan
A peek at how the world’s largest economies have fared recently.
Throughout financial commentary lately, we have seen many economists warn major economies risk entering recession (broad decline in economic activity) soon—if they aren’t already in one. Against that backdrop, America, China and Japan released some widely followed economic data at the end of Q3. Whilst the figures are backward-looking, we think they show ongoing resilience in the world’s three largest economies—evidence, in our view, of an economic reality that is better than many market observers anticipated based on financial publications we follow.[i]
Resilient US Consumer Spending
First up: US personal consumption expenditures (PCE), courtesy of the Bureau of Economic Analysis (BEA). This inflation-adjusted consumer spending measure includes goods and services—a contrast to the retail sales report, produced by the US Census Bureau, which isn’t inflation-adjusted and omits most services spending.
August inflation-adjusted PCE rose 0.1% m/m after July’s -0.1% dip, and the numbers were in line with 2022’s spending trends: stabilising services, weaker goods.[ii] (Exhibit 1) The latter fell -0.2% m/m, its fifth drop in the past eight months, whilst the former climbed 0.3%—its seventh straight rise.
Exhibit 1: US PCE, August 2021 – August 2022
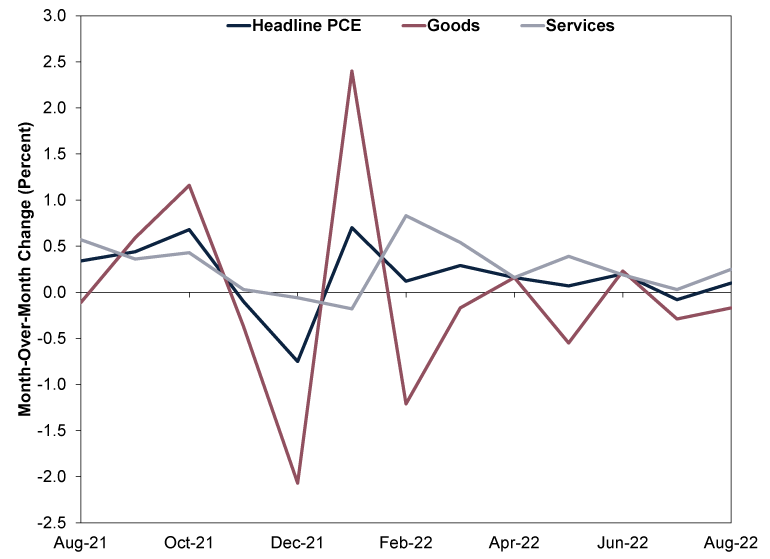
Source: FactSet, as of 3/10/2022.
The BEA’s report also includes PCE inflation, and the headline number—the US Federal Reserve’s preferred metric for tracking prices and the one on which it bases its inflation target—decelerated in August to 6.2% y/y from July’s 6.4%.[iii] However, most coverage we follow focussed on core PCE (which excludes volatile energy and food prices) accelerating from 4.7% to 4.9%. Whilst we understand an accelerating monthly figure tends to garner headline attention, in the context of 2022, core PCE has been slowing overall since February’s 5.4% y/y rate.[iv]
Most analysis that we encountered seemed pessimistic about consumers’ ability to continue spending amidst elevated prices. Whilst the theory behind this seems logical, we don’t think it holds in practice since our research shows most consumer spending doesn’t fluctuate much. It is what we have seen economists refer to as inelastic demand. Based on our studies, households typically won’t cut most essential services spending (e.g., housing and health care) regardless of economic conditions. However, they may adjust elsewhere during tougher economic times, possibly pulling back on forms of discretionary spending or shifting to cheaper goods.
Our review of the data suggests this may be happening, as select discretionary goods categories have weakened this year.[v] Spending in the jewelry & watches category has contracted in five of the past six months, and some recreational goods spending—including on musical instruments, gardening items and film and photographic supplies—has softened, too.[vi] Yet services expenditures have largely continued growing amidst elevated inflation.[vii] We don’t dismiss people’s economic pain—and sacrifice—as they alter habits in response to higher prices. But August’s figures further demonstrate elevated prices haven’t upended PCE, which comprises about 70% of US GDP, at least thus far.[viii]
Mixed Chinese September PMIs
September’s purchasing managers’ indexes (PMIs) out of China were mixed. PMIs are business surveys that aim to measure growth’s breadth. Readings above 50 imply broad expansion whilst below 50 suggest contraction. The Chinese government’s official manufacturing PMI rose to 50.1 from August’s 49.4—which may reflect a boost from policymakers’ stimulus measures.[ix] However, the non-manufacturing PMI (which includes services, real estate and construction) fell to 50.6 from August’s 52.6, with services dipping to 48.9 from August’s 51.9.[x] The Caixin September China PMIs, which reflect more small, private firms, were also mixed: Manufacturing slipped to 48.1 from August’s 49.5 whilst services hit 55.0 after August’s 55.5.[xi]
In our view, the big headwind facing the manufacturing and services sectors remains the government’s zero-COVID policy, as repeat and sudden COVID restrictions impede economic activity and hinder business planning. As Caixin’s September manufacturing report noted, unstable business expectations is an issue, as businesses report uncertainty around COVID policy has discouraged hiring—prompting multinationals to explore other locales to source their goods (e.g., Vietnam or India).[xii]
Whilst PMIs are a timely snapshot of recent economic conditions, they reveal only the breadth, not magnitude, of growth or contraction. Therefore, our research shows sub-50 PMIs don’t automatically mean contracting GDP—they may just indicate slowing economic growth. Output data (e.g., retail sales and industrial production) will provide more concrete details. Those have slowed lately, but we think it is worth remembering: Even tepid Chinese growth still contributes meaningfully to global GDP.[xiii] Moreover, we don’t think it is realistic to expect an economy as big as China’s to expand at a perpetually super-fast rate—especially when most big gains for a developing economy from activities like infrastructure spending are over, based on a theory we are familiar with called the law of diminishing returns, which states that initial infrastructure investments that drive big efficiency gains and stoke a flurry of activity. Subsequent investments in infrastructure see smaller rewards.
Japan: A Bright Spot
In the Land of the Rising Sun, August industrial production rose for a third straight month (2.7% m/m) thanks to a boost in production machinery, offsetting a slump in electronic parts & devices and motor vehicle production.[xiv] August retail sales rose for the sixth month in a row, climbing 4.1% y/y (1.4% m/m) and accelerating from July’s 2.4%.[xv] Higher retail sales is due partly to fuel sales, which likely reflects some higher energy costs.[xvi] But growth wasn’t solely from energy, as sales also rose for general merchandise and fabrics apparel and accessories.[xvii]
Alongside August output data, PMIs suggest a majority of businesses grew in September. Manufacturing hit 50.8 as some businesses reported signs of easing supply constraints, whilst services registered 52.2 thanks to looser COVID restrictions lifting demand.[xviii] Moreover, Japan’s composite PMI, which aggregates manufacturing and services output, was 51.0—better than the US, UK and eurozone’s September composite PMIs.[xix] Japan has benefitted from reopening-related tailwinds, with more likely to come in October as the country reopens fully to foreign tourists. We think this is probably a short-lived boost, as we have seen with other reopening economies, and one that doesn’t fundamentally improve the country’s longer-term economic issues (e.g., tepid domestic demand, monetary policy that strikes us as bizarre). But considering the widespread coverage of today’s global economic weak spots, we think recognising the resilience of the world’s biggest economies can help investors weigh how reality stacks up with pretty dour expectations.
[i] Source: The World Bank, as of 7/10/2022. Statement based on 2021 GDP (in constant 2015 US dollars) for the US, China and Japan. GDP refers to gross domestic product, a government-produced measure of national economic output.
[ii] Source: FactSet, as of 3/10/2022.
[iii] Ibid.
[iv] Ibid.
[v] Ibid.
[vi] Ibid.
[vii] Ibid.
[viii] Source: Bureau of Economic Analysis, as of 7/10/2022. Statement based on PCE as a percentage of GDP, Q2 2022.
[ix] Source: National Bureau of Statistics, as of 3/10/2022.
[x] Ibid.
[xi] Source: S&P Global, as of 5/10/2022.
[xii] Ibid.
[xiii] See note ii.
[xiv] Ibid.
[xv] Ibid.
[xvi] “Japan's Factories Ramp Up Output in Aug, Govt Eyes Fresh Stimulus Boost,” Daniel Leussink and Kaori Kaneko, Reuters, 29/9/2022. Accessed via MSNMoney.
[xvii] Ibid.
[xviii] Source: S&P Global, as of 5/10/2022.
[xix] Ibid.
Get a weekly roundup of our market insights.
Sign up for our weekly e-mail newsletter.

You Imagine Your Future. We Help You Get There.
Are you ready to start your journey to a better financial future?

Markets Are Always Changing—What Can You Do About It?
Get tips for enhancing your strategy, advice for buying and selling and see where we think the market is headed next.
Related Resources
-
In The News Predictions of an AI dystopia are the height of arrogance2026-03-23
-
Politics Beyond the War: A Political Roundup Covering America, Canada and Denmark2026-03-18
-
Economics Doubts Aplenty After UK January GDP Flatlined2026-03-18
-
Environmental, Social and Governance Insights Responsible Investment Newsletter 20262026-03-11


Contact Us
Learn why 195,000 clients trust Fisher Investments and its affiliates to manage their money and find out how we may be able to help you achieve your financial goals.
As of 31/12/2025. Includes Fisher Investments and its affiliates.
New to Fisher? Call Us.
Contact Us Today