Personal Wealth Management / Economics
Taking Industrial America’s Temperature
Recent data from America’s manufacturers suggest conditions are better than many commentators we follow think.
Heavy industry is only a small slice of America’s economy and isn’t very representative, in our view.[i] But we think it is still worth a check-in, particularly when commentators we follow seem very dour about economic prospects in the world’s largest economy. Lately, we find many analysts disregard signs of improvement or interpret them negatively in a phenomenon we call the pessimism of disbelief. We have seen this attitude extend to manufacturing, but a review of recent data from the US reveals that, despite some mixed figures, factories there overall are contributing to growth.
Let us start with the most timely figures, the Institute for Supply Management’s (ISM) and S&P Global’s November US manufacturing purchasing managers’ indexes (PMIs). PMIs are business surveys that aim to tally the percentage of companies reporting higher activity in a given month. Both outlets’ US manufacturing PMIs fell below 50—indicating more respondents reported contraction than growth—with new orders (which we think are forward-looking because today’s orders are generally tomorrow’s production) also sinking.[ii] Is that a harbinger of worse to come? Perhaps, but we don’t think it is assured. Because PMIs measure only growth’s breadth, not its magnitude, ISM manufacturing’s dip to 49.0 from October’s 50.2 and S&P Global’s to 47.7 from 50.4 don’t necessarily mean falling output.[iii] If the majority of manufacturing firms surveyed see contraction, but the minority’s actual output is larger, growth could still occur overall—we will have to wait and see. Regardless, we caution against drawing big conclusions from any one data point, for good or ill.
Meanwhile, America’s regional PMIs, which represent a broad swath of US Federal Reserve branch districts, were mixed in November.[iv] (Note: Regional PMIs’ dividing line between contraction and expansion is zero.)
- New York’s Empire State Manufacturing Survey rose 13.6 points to 4.5, its first positive reading since July.[v]
- In contrast, the Philadelphia Fed’s PMI fell -10.7 points to -19.4.[vi]
- Richmond’s PMI edged up from -10 to -9 and Kansas City’s ticked from -7 to -6. Still negative, but indicating a narrower swath of firms seeing contraction.[vii]
- To round them out, Dallas’s PMI fell -5.2 points to 0.8, barely positive, suggesting little change from October.[viii]
Beyond PMIs, we think the latest releases measuring actual US output suggest Q4 business equipment investment and manufacturing production are off to a good start. Whilst America’s industrial production fell -0.1% m/m in October, reversing September’s 0.1% gain, the data suggest this was largely a function of a -1.5% m/m drop in utility production, perhaps tied to weather.[ix] But manufacturing, the largest segment covered in these data, rose 0.1% m/m in October, its fourth straight monthly gain.[x] Then, too, within manufacturing, commodity-orientated industries detracted the most. Wood, metal and mineral products shrank in durable manufacturing, whilst petroleum and chemical products contracted on the nondurable side.[xi] More than offsetting these pockets of manufacturing weakness: Higher value-added machinery and equipment rose strongly.[xii] In our view, this hints at business investment remaining firm after Wednesday’s revised Q3 2022 US GDP report showed it climbed 5.1% annualised (the rate at which output would rise over a full year if the quarter-on-quarter rate repeated all four quarters).[xiii]
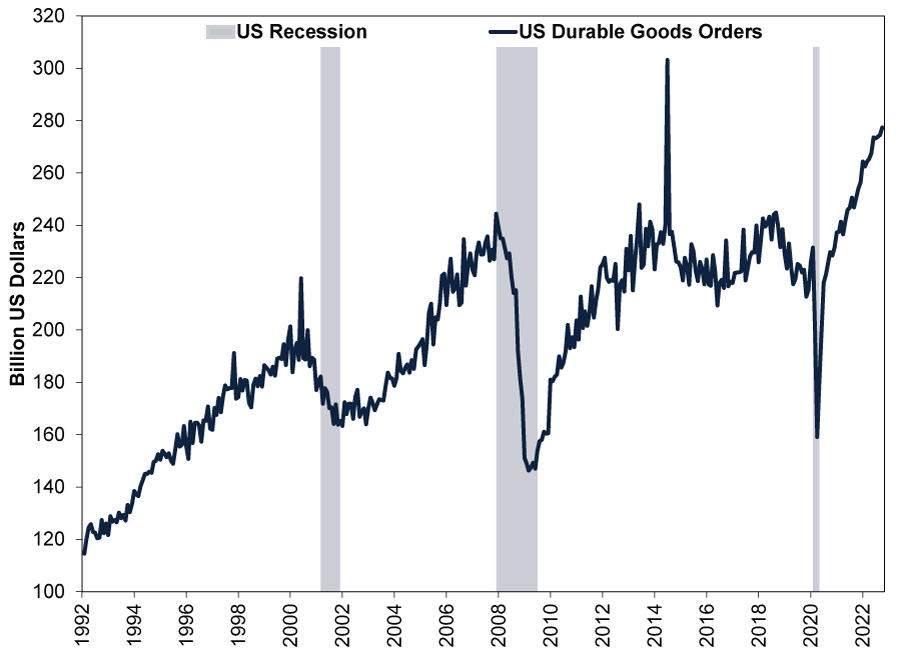
Looking ahead, America’s October factory orders for durable goods—a forward indicator of output—rose 1.0% m/m.[xiv] Nondefense capital goods orders excluding aircraft, which we find less volatile and many economists use as a proxy for business investment, rose 0.7% m/m.[xv] As Exhibit 1 shows, though, headline US durable goods orders haven’t been very volatile since reopening—they have shot higher. This may be partially due to inflation—durable goods orders aren’t inflation adjusted—but nonetheless, we think it suggests businesses continue spending on big ticket machinery and equipment.
Exhibit 1: US Durable Goods Orders Making New Cycle Highs
Source: US Federal Reserve Bank of St. Louis, as of 2/12/2022. Durable goods orders, February 1992 – October 2022. US recession shading based on the National Bureau of Economic Research Business Cycle Dating Committee’s chronology.
We don’t think these data rule out the US recession (broad economic contraction) most observers we follow say is likely. They are broadly mixed, in our view, like so many other data points these days. But they also don’t seem categorically awful or recessionary to us. Now, we wouldn’t overrate American manufacturing’s impact—for good or ill. It is just 11.3% of US GDP.[xvi] Yet we also think overlooking the data would be a mistake, particularly when economic sentiment appears broadly dour amongst headlines we see. In such scenarios, even small things going a little better than feared can be fuel for a recovery, in our experience.
[i] Source: US Bureau of Economic Analysis, as of 2/12/2022. Manufacturing percent of GDP, Q2 2022.
[ii] Source: US Institute for Supply Management and S&P Global, as of 2/12/2022. US Manufacturing PMI, November 2022.
[iii] Ibid.
[iv] Source: US Federal Reserve Banks of New York, Philadelphia, Richmond, Dallas and Kansas City, as of 2/12/2022. Regional manufacturing surveys, November 2022.
[v] Ibid.
[vi] Ibid.
[vii] Ibid.
[viii] Ibid.
[ix] Source: US Federal Reserve, as of 2/12/2022. Industrial production and its components, October 2022.
[x] Ibid.
[xi] Ibid.
[xii] Ibid.
[xiii] Source: US Bureau of Economic Analysis, as of 2/12/2022. Private non-residential fixed investment, Q3 2022.
[xiv] Source: US Census Bureau, as of 2/12/2022. Durable goods orders, October 2022.
[xv] Source: US Census Bureau, as of 2/12/2022. Nondefense capital goods orders excluding aircraft, October 2022.
[xvi] See note i.
Get a weekly roundup of our market insights.
Sign up for our weekly e-mail newsletter.

You Imagine Your Future. We Help You Get There.
Are you ready to start your journey to a better financial future?

Markets Are Always Changing—What Can You Do About It?
Get tips for enhancing your strategy, advice for buying and selling and see where we think the market is headed next.
Related Resources
-
Macro Insights Q1 2026 Global Markets Review & Outlook2026-05-12
-
Macro Insights Why Global Small Cap2026-05-07
-
Market Analysis What to Think of Another Aussie Rate Hike2026-05-05
-
Market Analysis Europe’s Resilient Q1 GDP2026-05-01


Contact Us
Learn why 200,000 clients trust Fisher Investments and its affiliates to manage their money and find out how we may be able to help you achieve your financial goals.
As of 31/03/2026. Includes Fisher Investments and its affiliates.
New to Fisher? Call Us.
Contact Us Today