Personal Wealth Management / Market Analysis
The Real Lesson From Britain’s ‘Austerity’ Error
Last decade’s ‘austerity’ wasn’t quite what headlines imply, in our view.
Is the UK government about to repeat a terrible mistake? That question is stealing quite a few headlines as many financial commentators begin to anticipate Chancellor of the Exchequer Rishi Sunak moving to rein in public finances after running a massive public deficit this year.[i] Some commentators we follow are warning about the prospect of an increase to capital gains tax rates, which one government commission recently recommended. But the vast majority of commentators we follow seem preoccupied with the potential for spending cuts, which they see as a repeat of the 2010s’ “austerity”—the term widely used to describe the government’s approach to public finances during the last decade. These commentators argue big public spending cuts under former Prime Minister David Cameron and his Chancellor, George Osborne—which continued under Osborne’s successor, Phillip Hammond—doomed the UK economy to a decade of lacklustre gross domestic product (GDP) growth.[ii] Cutting spending now, they argue, would repeat this error and cause the rest of the world to far outstrip British economic growth after the pandemic fades. We don’t think it is worthwhile trying to predict what the government will do or how it will affect the UK economy, as there are just too many unknowns and human inputs. But in our view, a brief look at recent history might offer investors some helpful perspective.
Based on our reading of government pronouncements and press coverage of them during the last decade, it is true that Osborne and Hammond stressed deficit reduction whilst in office, and they used the word “austerity” a lot. But as Exhibit 1 shows, their actions didn’t amount to austerity as most of the world would recognise it. There were no draconian spending cuts. Indeed, annual public spending fell in just one calendar year, 2013, and by only £7.6 billion from the year before—a -0.9% drop.[iii] What actually happened is that Osborne deviated from his predecessor, Alistair Darling’s, plans and reduced the projected rate of public spending increases. Spending still rose, just not by as much as the prior government intended.[iv] We guess you could argue these fit under the loose definition of budget cuts, but changing a plan isn’t a spending cut if actual spending doesn’t drop.
Exhibit 1: The UK’s Not-So-Austere Decade
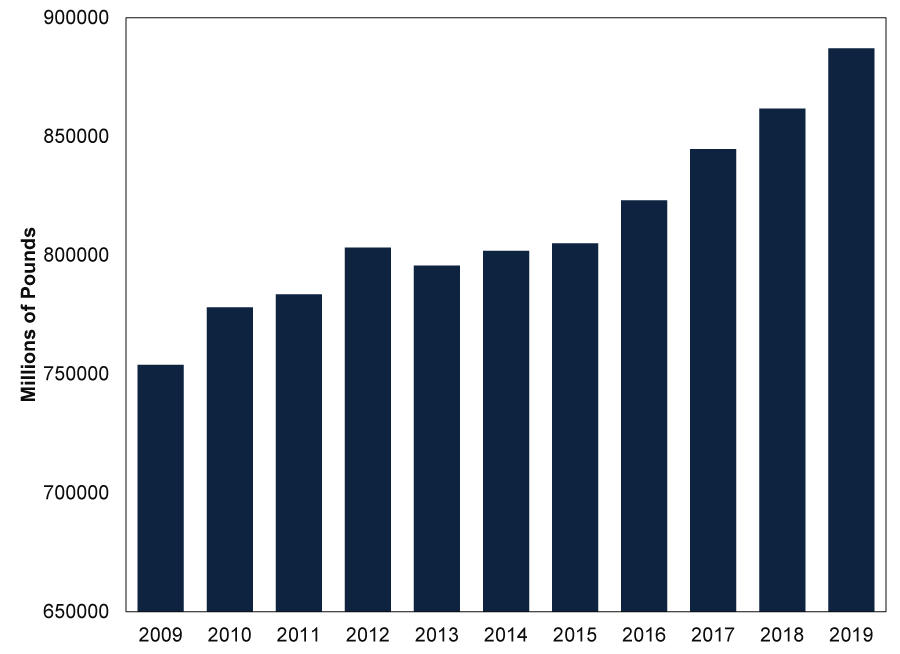
Source: Office for National Statistics, as of 2/12/2020. UK Government Annual Total Managed Expenditure, 2009 – 2019.
In response to the above, one could logically argue, yah, but a lot of that spending is transfer payments, such as benefits—those don’t count in GDP, so you should narrow your focus to get a better look. Fair enough, although much of the last decade’s commentary centered on benefit cuts as a major economic drag, hence our look at the total including transfer payments. But even looking at the government spending component of GDP, the picture doesn’t really change. That, too, fell in 2013 only, and not by much—just -0.5% from 2012.[v]
What we find interesting about all this is that 2013 is when UK GDP finally accelerated after a fitful few years and flirtation with double-dip recession. GDP grew 1.3% in 2011 and 1.4% in 2012.[vi] In 2013, it sped to 2.2%, followed by 2.9% in 2014 and 2.4% in 2015.[vii] So if GDP accelerated the one year the UK had some actual austerity, we it would be shortsighted not to ask why—and if there was another headwind during the earlier, lacklustre years.
We think there is a simple answer to this: quantitative easing (QE). That is the colloquial name for the Bank of England’s (BoE) Asset Purchase Programme, through which it purchases long-term gilts from banks in hopes of adding to bank reserves, reducing long-term interest rates and stimulating lending.[viii] The BoE’s QE programme ran from early 2009 to … drumroll … November 2012. Broad money supply and lending—particularly business lending—were negative for a big chunk of that stretch.[ix] They improved when QE stopped, which we don’t think is a coincidence. Whilst QE reduced long-term interest rates, the BoE pinned short rates at 0.5%.[x] When long rates fall whilst short rates stay steady, it flattens the yield curve, which is a graphical representation of a single issuer’s interest rates across a range of maturities. That isn’t great for banks, which borrow at short-term rates and lend at long-term rates, making the difference between the two, known as the yield curve spread, a strong influence on their new lending’s profitability. Banks aren’t charities, so every lending decision considers risk and reward. Small margins reduce the potential reward for taking risk, which we think saps the incentive to lend to all but the most creditworthy firms. As a result, we think QE discouraged banks from lending enthusiastically to UK businesses. Like the US, the UK has a fractional reserve banking system, which means banks create most new money through lending. So when lending sags, so does broad money supply, which hamstrings economic growth overall. That, in a nutshell, is what we think happened in the UK—and when QE ended, broad money supply improved, the economy got more fuel, and GDP grew faster.[xi]
This is mixed news for investors today, we realise, considering the BoE is once again engaged in a massive QE program. Letting it expire next year—whilst letting businesses reopen—would likely bring a big economic net benefit, in our view, as it would likely let the UK’s flat yield curve steepen.[xii] (That viewpoint applies to the US, eurozone and Japan, too.) On the bright side, the 2010s also showed that whilst QE is an economic headwind, it doesn’t automatically derail equity markets.[xiii] But overall and on average, we think the real repeat error is continuing the QE experiment, regardless of what Sunak and his team decide to do on the public spending front.
[i] Source: Office for National Statistics, as of 2/12/2020.
[ii] GDP is a government-produced measure of economic output.
[iii] Source: Office for National Statistics, as of 2/12/2020.
[iv] Source: HM Treasury, as of 2/12/2020.
[v] Source: FactSet, as of 2/12/2020. UK General government spending growth in 2013.
[vi] Source: FactSet, as of 2/12/2020. Real UK GDP growth in 2011 and 2012.
[vii] Ibid. Real UK GDP growth in 2013, 2014 and 2015.
[viii] Source: Bank of England, as of 2/12/2020.
[ix] Ibid.
[x] Ibid.
[xi] Source: Bank of England and Office for National Statistics, as of 2/12/2020.
[xii] Source: FactSet, as of 2/12/2020.
[xiii] Source: FactSet, as of 2/12/2020. Statement refers to the MSCI UK Investible Markets Index total return.
Get a weekly roundup of our market insights.
Sign up for our weekly e-mail newsletter.

You Imagine Your Future. We Help You Get There.
Are you ready to start your journey to a better financial future?

Markets Are Always Changing—What Can You Do About It?
Get tips for enhancing your strategy, advice for buying and selling and see where we think the market is headed next.
Related Resources
-
Market Volatility What the Latest Global Flash PMIs Reveal2026-03-31
-
Market Analysis Will Lower Capital Requirements Send Banks Higher?2026-03-31
-
Politics This Week in Gridlock: Europe Edition2026-03-27
-
In The News Predictions of an AI dystopia are the height of arrogance2026-03-23


Contact Us
Learn why 195,000 clients trust Fisher Investments and its affiliates to manage their money and find out how we may be able to help you achieve your financial goals.
As of 31/12/2025. Includes Fisher Investments and its affiliates.
New to Fisher? Call Us.
Contact Us Today