Personal Wealth Management / Market Analysis
What Q3 Earnings Results Say About Stocks and Inflation
Gross margins are sending a compelling message.
Q3 earnings season is drawing to a close for US corporations, which still have mandatory quarterly reporting requirements—making them a handy snapshot of profit and sales results for globally diversified investors. With over 91% of companies in the S&P 500 Index reporting results through Monday, profits are up 39.2% from Q3 2020, shattering analysts’ consensus expectations for a 23.5% y/y rise.[i] We don’t find strong growth shocking, considering earnings fell -5.8% y/y a year ago, meaning today’s figures look back to a depressed base.[ii] But we do think the big divergence from expectations is noteworthy, particularly for what it reveals about how companies are adapting to the supply chain crunch, labour shortage and rising costs that many financial commentators we follow warn are hobbling global commerce.
All US sectors enjoyed growing earnings in Q3, with growth rates ranging from 3.7% y/y (Utilities) to irrational (Energy, whose net income rose from a -$1.5 billion loss in Q3 2020 to a $24.8 billion gain, making the growth rate mathematically impossible to calculate).[iii] The other top sectors, Materials (90.1% y/y) and Industrials (69.2%), received a clear reopening boost and benefitted from easy year-over-year comparisons. Both sectors earnings were weak in Q3 2020, tied to lockdowns’ impact on economic activity globally, creating low-hanging fruit for earnings to improve when reopening boosted demand for raw materials and manufacturing.[iv] But we don’t think the same can be said of two sectors that were close on their heels: Tech (36.3%) and Communication Services (35.0%), whose Interactive Media & Services industry is home to several Tech-like giants.[v] Both sectors were resilient during lockdowns, with minimal damage to earnings in Q2 2020 and modest growth in Q3 2020.[vi] In our view, their ability to generate fast growth off relatively difficult year-over-year benchmarks speaks to just how strong their fundamentals are now.
Exhibit 1 offers one way to see this: gross profit margins. That is, sales minus cost of goods, divided by cost of goods. This is a quick and dirty measure of a company’s core profitability before adjustments for taxes, debt service and other accounting items that are often subject to one-off skew. Our research finds companies with slim margins generally have to get outside financing to fund expansion (think: bank loans or bond issuance) and have a hard time swallowing rising costs. Those with fat margins are much more self-sufficient. They can plow profits back into the business, self-financing future growth. They also have more bandwidth to weather cost pressures. Tech and Communication Services have the fattest gross margins in the S&P 500, which may not shock. But you might be surprised to see both have overall improved margins this year.
Exhibit 1: Tech and Tech-Like Companies’ Magically Expanding Gross Margins
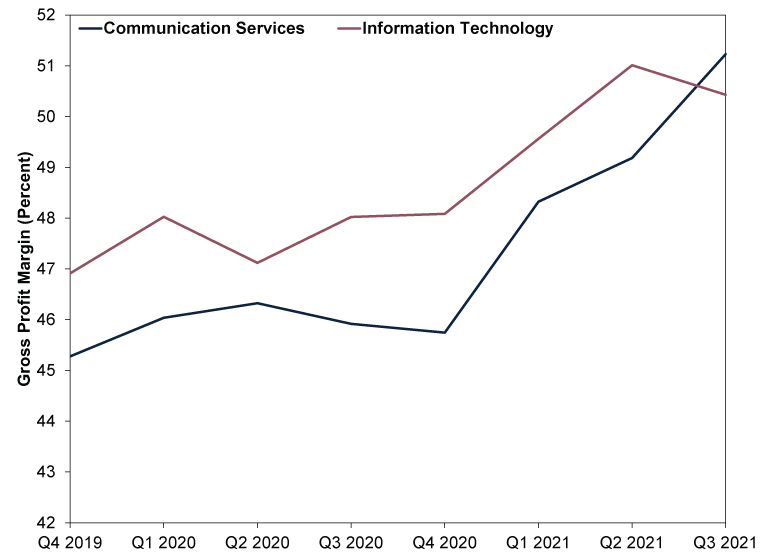
Source: FactSet, as of 9/11/2021. Quarterly gross profit margins for Information Technology and Communication Services, Q4 2019 – Q3 2021.
Those improvements happened despite the well-documented pressure on companies’ costs globally. Financial commentators we follow globally warn rising wages, high input costs and big shipping costs and delays are hamstringing businesses the world over. But for these sectors, we think these factors are less of a headwind. You don’t ship digital services on a container ship. Nor do you need lumber and copper to build software. Our research finds these companies also tend to have relatively leaner workforces, which also happen to be nimble and global. A restaurant can’t hire remote workers when business picks up and there are no local applicants—an Internet-based company can. We think it is no accident, therefore, that Tech is amongst the S&P 500’s and MSCI World Index’s top-performing sectors year to date, nor that the global Interactive Media & Services industry is up over 45%.[vii]
Cost controls aren’t the only thing driving earnings right now—if they were, then Tech and Communication Services would probably be alone in the universe of expanding margins. But as Exhibit 2 shows, they aren’t. Their margins top the leaderboard in absolute terms, but margins are resilient across the board, even in sectors like Industrials and Utilities, which are more prone to rising input costs. Consumer Discretionary and Staples, too, have weathered rising costs and wages rather well, with margins above pre-pandemic levels.
Exhibit 2: Gross Margins Are Pretty Resilient
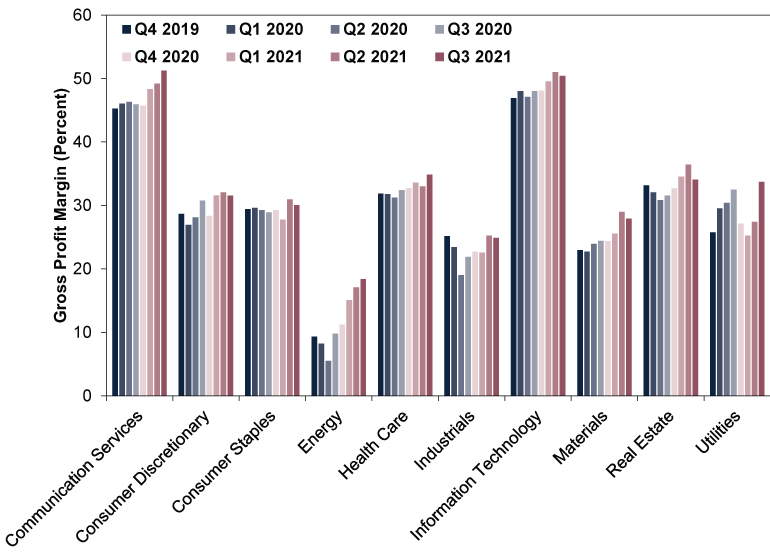
Source: FactSet, as of 9/11/2021. Quarterly gross profit margins for all available S&P 500 sectors, Q4 2019 – Q3 2021. Financials is excluded since gross margins don’t apply to that sector’s business model.
How did they do it? We think the answer is simple: Numerous indicators show the global economy is quite strong right now and demand is robust, giving a lot of companies strong pricing power.[viii] That isn’t fun if you are a customer faced with higher grocery bills and other personal costs. But it is the reason our research shows earnings can and do rise during periods of high inflation—which, in turn is one reason why we think stocks are often amongst the best inflation hedges around.[ix]
Combine better-than-expected headlines with resilient gross margins, and we think it becomes clear analysts overestimated supply shortages’ and rising costs’ impact—and underestimated companies’ ability to adapt. This is what we think generally propels returns in a long stretch of rising equity markets, known as a bull market: Bad thing hits headlines, people fear bad thing, expectations fall, reality goes better than feared, boom, positive surprise. In our view, that is the classic journey up the proverbial wall of worry bull markets are often said to climb and a timely reminder: Stocks don’t need perfection. We think they just need companies to continue adapting and finding ways to overcome whatever obstacles arise.
[i] Source: FactSet, as of 9/11/2021.
[ii] Ibid
[iii] Ibid.
[iv] Ibid.
[v] Ibid.
[vi] Ibid.
[vii] Ibid. MSCI World Index Interactive Media & Services return with net dividends in GBP, 31/12/2020 – 8/11/2021.
[viii] Ibid. Statement refers to gross domestic product and purchasing managers’ indexes for the US, UK, China, Germany, France, Italy and Spain. Gross domestic product is a government-produced measure of economic output, whilst purchasing managers’ indexes are surveys that aim to estimate the percentage of businesses growing in a given month.
[ix] Ibid. Statement based on S&P 500 Index total returns in USD and MSCI World Index price returns in GBP. Currency fluctuations between the dollar and pound may result in higher or lower investment returns.
Get a weekly roundup of our market insights.
Sign up for our weekly e-mail newsletter.

You Imagine Your Future. We Help You Get There.
Are you ready to start your journey to a better financial future?

Markets Are Always Changing—What Can You Do About It?
Get tips for enhancing your strategy, advice for buying and selling and see where we think the market is headed next.
Related Resources
-
Macro Insights Q1 2026 Global Markets Review & Outlook2026-05-12
-
Macro Insights Why Global Small Cap2026-05-07
-
Market Analysis What to Think of Another Aussie Rate Hike2026-05-05
-
Market Analysis Europe’s Resilient Q1 GDP2026-05-01


Contact Us
Learn why 200,000 clients trust Fisher Investments and its affiliates to manage their money and find out how we may be able to help you achieve your financial goals.
As of 31/03/2026. Includes Fisher Investments and its affiliates.
New to Fisher? Call Us.
Contact Us Today