Personal Wealth Management / Market Analysis
Why Rising Interest Rates Needn’t Stall Big Tech
Our research shows fluctuations in equity market sectors’ returns are normal, and we don’t think it is beneficial for investors to read much into it.
Are US Treasury markets hinting at trouble ahead for the large Tech and Tech-like shares that have led this extended period of generally rising equities (i.e., a bull market)?[i] Some market commentators we follow on both sides of the Atlantic have suggested they are, based on the observation that rising long-term US sovereign debt yields have coincided with short-term pullbacks in Tech shares at various points this year, including points in recent weeks.[ii] With the US Federal Reserve signalling asset purchases made through its quantitative easing (QE) programme will wind down soon, we have seen some analysts posit that a continued rise in long rates means tough times for Tech and Tech-like firms from here. But our study of market history shows rising rates aren’t automatically negative for Tech shares, as we will detail below. Whilst we don’t think rising rates are likely to persist, we still think investors would likely benefit from keeping that perspective in mind.
According to those warning rising interest rates will weigh on Tech and Tech-like firms’ returns, when yields are low, investors are more willing to buy growth-orientated companies—firms that generally reinvest most profits in their business instead of paying high dividends and seek to capitalise on innovation and long-term technological trends—on the expectation of big future profits. But when long-term yields are rising, we have seen some observers say investors then become more optimistic about upcoming economic and market conditions, so they supposedly prefer companies poised to benefit most from stronger economic activity in the present—ordinarily, value firms, whose profits tend to be highly sensitive to economic trends, based on our research. To support this claim, we have seen analysts cite a mix of recent data as interest rates have ticked higher, including the first weekly outflow from Tech mutual and exchange-traded funds in the week ending 22 September—a finding we have seen some observers we follow call indicative of potential Tech sector weakness.[iii]
But looking beyond what just happened shows a more complicated picture, in our view, as recent history proves Tech shares can do just fine alongside rising rates. From 25 July, 2012 to 2013’s end, the 10-year US Treasury yield rose from 1.43% to 3.04%.[iv] Tech rose 27.9% over that stretch—a bit behind global markets’ 33.0%, but still up nicely.[v] Or consider when the US Treasury yield climbed from 1.37% to 3.24% between 8 July, 2016 and 8 November, 2018.[vi] Tech’s 67.5% return over that timeframe more than doubled global equities’ 29.2%.[vii]
Taking a longer perspective, our research shows Tech has both risen and fallen in a variety of interest rate environments—there isn’t a set pattern. Over the past two decades, the correlation coefficient (a statistical measurement of the relationship between two variables) between Tech’s relative returns and Treasury yields was -0.10.[viii] A correlation coefficient of 1.00 means the datasets have identical movement whilst -1.00 means the assets move completely inversely to each other, so a -0.10 correlation implies not much relation at all.
Exhibits 1 and 2 display this lack of correlation visually. Just as rates’ swings didn’t impede Tech shares’ leadership for much of 2010 – 2020, they didn’t prevent the sector’s lag for most of the 2001 – 2010 period.
Exhibit 1: No Interest Rate/Tech Correlation, 2010 – 2020
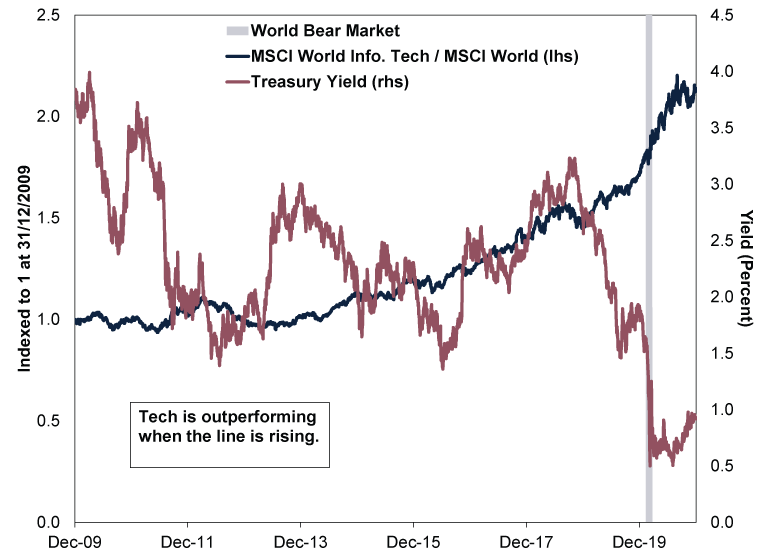
Source: FactSet, as of 4/10/2021. MSCI World Information Technology and MSCI World returns with net dividends in GBP and 10-year US Treasury yield, 31/12/2009 – 31/12/2020. A bear market is a broad, lasting equity market decline of -20% or worse with an identifiable fundamental cause.
On the flipside, Tech lagged the broader market in the 2000 – 2010 decade—but Treasury yields didn’t tell you much about Tech’s returns then, either. (Exhibit 2)
Exhibit 2: No Interest Rate/Tech Correlation, 2001 – 2010
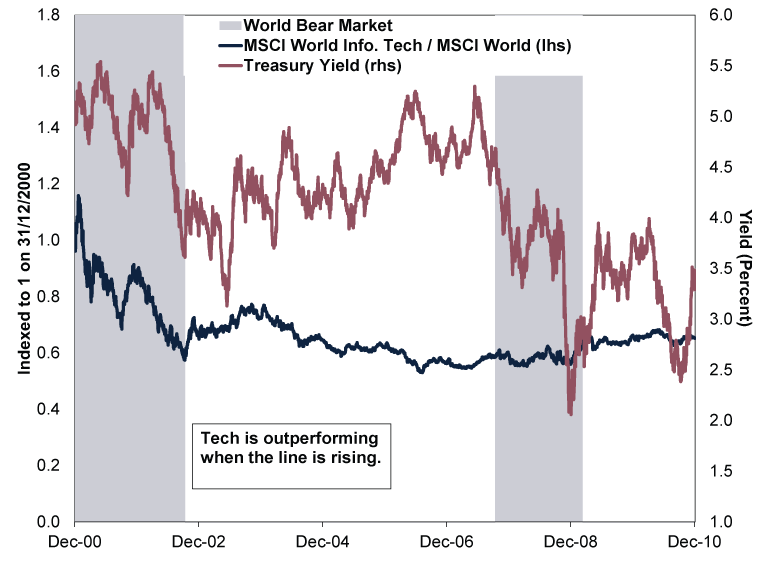
Source: FactSet, as of 4/10/2021. MSCI World Information Technology and MSCI World returns with net dividends in GBP and 10-year US Treasury yield, 31/12/2000 – 31/12/2010. A bear market is a broad, lasting equity market decline of -20% or worse with an identifiable fundamental cause.
Now, we have seen some commentators note that rising long-term interest rates could steepen the yield curve—which plots a single issuer’s interest rates across a given range of maturities—which we think tends to benefit value-orientated companies. Value firms, which our research shows tend to be lower credit quality, typically depend heavily on bank lending for capital, as they can’t access capital markets as easily as big growth firms. In modern banking systems like the US and UK, banks borrow at short-term rates to fund long-term loans. Hence, we think the gap between short and long rates is a proxy for banks’ net interest margins—the potential profit on new loans. With short rates near zero, rising long rates mean a bigger potential profit, and our study of over 100 years of economic theory and history suggests that makes risk-taking a more worthwhile endeavour, which is why we think a steeper yield curve incentivises banks to lend to a wider swath of borrowers.
But we don’t think long-term interest rates are likely to keep shooting higher and stay elevated. Inflation (the general rise in prices economy-wide) is the primary determinant of long rates, according to our research. Whilst inflation rates globally are elevated presently, we think these stem from a combination of passing factors, e.g., economic reopenings and global supply shortages/bottlenecks.[ix] The likelihood they continue driving fast price gains from here seems low, in our view, especially since our research has found investment pouring into new production capacity. In our view, inflation likely returns to its slower pre-pandemic rate. Note, too, the Fed’s slowing QE asset purchases (i.e., tapering) in 2013 and 2014 didn’t lead to an extended period of higher rates. After former Federal Reserve chairman Ben Bernanke signalled a taper in May 2013, the 10-Year US Treasury yield rose from 2.03% to as high as 3.04% by the end of the year.[x] The Fed began tapering in January 2014 and ended by October that year. By January 2015, yields were back to May 2013 levels.[xi]
In our experience, volatility in sector trends is normal, and we think reacting to it can be as error-prone as reacting to pullbacks (short-term dips within bull markets). Broad markets don’t move in gradual, smooth lines—and neither do the market’s subcategories. Moreover, our research shows temporary reversal of sector and style (e.g., growth and value) leadership trends often accompany volatility in broad equity markets, and this can end as quickly as it begins. In our view, reacting to short-term, unpredictable movements can invite investing errors. Instead, we think investors benefit from looking beyond the immediate short term and look to the 3 – 30 month timeframe markets typically weigh.
As turbulent as the past several weeks have been, the longer-term economic factors equities care about haven’t much changed, in our view. Most major economies are near or above pre-pandemic levels of economic output—and growth is slowing as expected following a reopening-related pop.[xii] We think this slow-growth environment likely resembles the pre-pandemic environment, which our research shows favoured big, growth-orientated firms—the kind that boast big profit margins that can buffer against the kind of cost pressures plaguing other industries today. Tech and Tech-like shares did best in that pre-COVID environment, and we think they are likely to continue leading despite the occasional short-term reversal.[xiii]
[i] Source: FactSet, as of 6/10/2021. Statement based on MSCI World and MSCI Information Technology returns with net dividends, in GBP, 16/3/2020 – 5/10/2021.
[ii] Source: FactSet, as of 6/10/2021. Statement based on MSCI Information Technology returns with net dividends, in GBP, and US 10-Year Treasury Yields, 31/12/2020 – 5/10/2021.
[iii] “Global Equity Funds See Their First Outflows in 2021 – BoA,” Saikat Chatterjee, Reuters, 24/9/2021. Accessed via Yahoo! Finance.
[iv] Source: FactSet, as of 4/10/2021. US Treasury Yield, 25/7/2012 – 31/12/2013.
[v] Ibid. MSCI World and MSCI World Information Technology returns with net dividends, in GBP, 25/7/2012 – 31/12/2013.
[vi] Ibid. US Treasury Yield, 8/7/2016 – 8/11/2018.
[vii] Ibid. MSCI World and MSCI World Information Technology returns with net dividends, in GBP, 8/7/2016 – 8/11/2018.
[viii] Source: FactSet, as of 5/10/2021. US 10-Year Treasury Yield and MSCI World and MSCI World Information Technology returns with net dividends in GBP, 31/12/2000 – 31/12/2020. Correlation calculation uses weekly change in MSCI World Index / MSCI World Information Technology Index, indexed to 1 at 31/12/2000, and weekly change in 10-Year Treasury yield starting on 31/12/2000.
[ix] Source: FactSet, as of 6/10/2021. Statement based on year-over-year change in UK Consumer Price Index for August 2021, US Consumer Price Index for August 2021 and eurozone Harmonised Consumer Price Index for September 2021.
[x] Source: St. Louis Federal Reserve, as of 6/10/2021. 10-Year US Treasury Constant Maturity Rate, 22/5/2013 – 31/12/2013.
[xi] Ibid. 10-Year US Treasury Constant Maturity Rate, 6/1/2015.
[xii] Source: FactSet, as of 6/10/2021. Statement based on GDP levels and annualised GDP growth rates for UK, eurozone and US, Q3 2020 – Q2 2021.
[xiii] Source: FactSet, as of 6/10/2021. Statement based on MSCI World and MSCI World Information Technology returns with net dividends, in GBP, 31/12/2015 – 31/12/2020.
Get a weekly roundup of our market insights.
Sign up for our weekly e-mail newsletter.

You Imagine Your Future. We Help You Get There.
Are you ready to start your journey to a better financial future?

Markets Are Always Changing—What Can You Do About It?
Get tips for enhancing your strategy, advice for buying and selling and see where we think the market is headed next.
Related Resources
-
Market Analysis A Market Perspective on Iran Truce Talks2026-06-17
-
Market Analysis Gold Fails the Safe Haven Test Again2026-06-17
-
Macro Insights Japanese Equity Outperformance & Why It's Poised to Continue2026-06-15
-
Macro Insights Assessing Private Credit Risks and Exposures2026-06-09


Contact Us
Learn why 200,000 clients trust Fisher Investments and its affiliates to manage their money and find out how we may be able to help you achieve your financial goals.
As of 31/03/2026. Includes Fisher Investments and its affiliates.
New to Fisher? Call Us.
Contact Us Today