Personal Wealth Management / Market Analysis
Why the Next Bull Market Probably Doesn’t Hinge on Buybacks
The evidence suggests share buybacks don’t drive returns, contrary to popular belief.
With the global economy ground to a halt and companies about to begin announcing quarterly earnings results for Q1, companies are battening down the hatches. Several have cancelled dividends and share buybacks in recent weeks, leaving headlines globally asking: Where will a recovery come from if companies aren’t buying their own shares? The line of logic we have seen throughout financial news coverage of this topic argues rising share buybacks were the primary source of demand for equities during the bull market (long period of generally rising equity markets) that ran from March 2009 to late February, powering shares’ climb.[i] Without them, some pundits claim there won’t be enough buyers to cement a recovery and eventually return shares to new highs. In our view, this misreads buybacks’ market impact. We think the data show buybacks weren’t the last bull market’s driving force, and the next bull can get underway with or without them.
One extreme analysis, based on the US Federal Reserve’s quarterly Flow of Funds reports, argues buybacks were the sole source of net positive demand for US shares (represented by the S&P 500 Index) during the last bull, contributing $4 trillion (roughly £3.25 trillion). “Contributions from all other sources—including exchange-traded funds, foreign buyers, insurers, mutual funds, broker-dealers, pensions, hedge funds and households—netted out to roughly zero.”[ii] In our view, some simple math is all it takes to poke holes into this line of reasoning. At the end of 2008, the S&P 500’s market capitalisation (the combined market value of all shares in the index) was about $7.85 trillion (£6.38 trillion).[iii] When 2019 ended, it was $26.76 trillion (£21.75 trillion).[iv] If the index’s market value rose by nearly £15.4 trillion, but corporations contributed only £3.25 trillion, then clearly other forces must be pushing up prices.
Exhibit 1 pokes even more holes, in our view. It overlays annual executed S&P 500 buybacks (meaning shares actually bought, not announced plans to buy a certain amount of shares) and annual S&P 500 returns in USD. As you will see, 2018 had the second-highest dollar volume of buybacks. Equities declined that year. In 2009 and 2010, when buybacks were at their lowest, the S&P 500 jumped 26.5% and 15.1% in USD, respectively (including 2009’s 62.1% jump from the bear’s March 9 low through yearend).[v] In the index’s best year of the last decade, 2013, buybacks were middling. Whilst this analysis focuses on US shares due to data availability, we think the logic and lessons are universal.
Exhibit 1: S&P 500 Buybacks and Returns
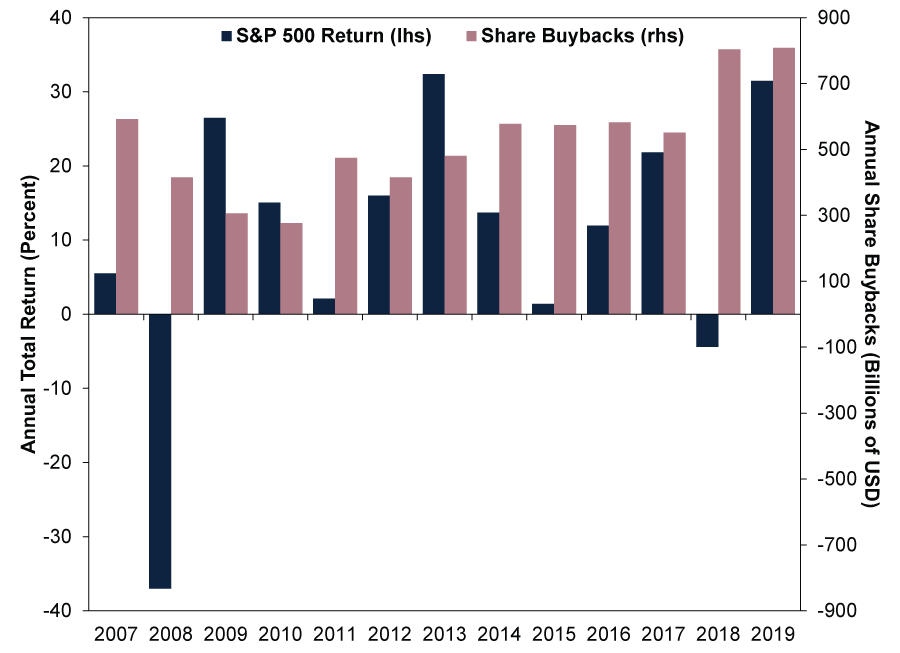
Source: Compustat North America and FactSet, as of 7/4/2020. S&P 500 annual total returns and annual share buybacks, 2007 – 2019. Presented in US dollars. Currency fluctuations between the dollar and pound may result in higher or lower investment returns.
We think there are some conceptual reasons that this shouldn’t surprise. Namely, the equity market is an auction marketplace—a place where buyers and sellers congregate and offer bids. In an auction, it generally isn’t the number or nature of buyers that matters, but their willingness to pay more for a slice of a company’s future earnings. In that marketplace, there is also mathematically no such thing as money pouring in. Every transaction has two sides—buyer and seller. It isn’t money pouring into a company, but a transfer from the buyer to the seller. Money in, money out. Therefore, it isn’t a huge shock to us that all the demand sources listed above netted out to zero.
In our view, what equities need in a new bull market isn’t new buyers, corporate or otherwise—the key ingredient is buyers with enough optimism and guts to pay a bit more for future earnings than the last person did. The money could come from cash on hand. Or they could sell fixed interest or other securities. Or they could sell one category of shares and buy another. The permutations aren’t endless, but there are many.
Buybacks do have an influence, but we think it is on the supply side, not the demand side. When companies buy their own shares, they basically retire them (i.e., take them off the market), shrinking overall share supply. At the simplest level, our research shows supply and demand drive share prices, so falling supply is a net positive. Yet even here, we wouldn’t overstate buybacks’ impact. A significant chunk of buyback activity serves to offset new shares issued as part of share-based employee compensation packages, which many companies use to give workers—and especially executives—more skin in the same and defer executive compensation. If companies issued these shares without buying back their in the open market, it would increase their outstanding share supply and dilute the worth of existing shareholders’ stakes, running counter to their presumed obligations to act in shareholders’ best interest. In other words, buybacks are more about keeping supply in check than artificially pumping prices.
When buybacks return, provided they are sound corporate investments (i.e., returns outweighing the costs), we can envision cheering them as a positive equity supply driver. But the next bull, like the last one, can start before companies resume buying in earnest, and its strength shouldn’t depend on their continuing to do so.
[i] Source: FactSet, as of 7/4/2020. Statement based on MSCI World Index returns with net dividends.
[ii] “The Suspension of Buybacks Will Reveal Who Was Swimming Naked” Dilantha De Silva, GuruFocus, 6 April 2020.
[iii] Source: FactSet, as of 7/4/2020. S&P 500 market capitalisation on 31/12/2008.
[iv] Ibid. S&P 500 market capitalisation on 31/12/2019.
[v] Ibid. S&P 500 total return, 31/12/2008 – 31/12/2009, 31/12/2009 – 31/12/2010 and 9/3/2009 – 31/12/2009. Presented in US dollars. Currency fluctuations between the dollar and pound may result in higher or lower investment returns.
Get a weekly roundup of our market insights.
Sign up for our weekly e-mail newsletter.

You Imagine Your Future. We Help You Get There.
Are you ready to start your journey to a better financial future?

Markets Are Always Changing—What Can You Do About It?
Get tips for enhancing your strategy, advice for buying and selling and see where we think the market is headed next.
Related Resources
-
Market Volatility Some Timeless Counsel After March’s Volatility2026-04-07
-
Market Volatility What the Latest Global Flash PMIs Reveal2026-03-31
-
Market Analysis Will Lower Capital Requirements Send Banks Higher?2026-03-31
-
Politics This Week in Gridlock: Europe Edition2026-03-27


Contact Us
Learn why 200,000 clients trust Fisher Investments and its affiliates to manage their money and find out how we may be able to help you achieve your financial goals.
As of 31/03/2026. Includes Fisher Investments and its affiliates.
New to Fisher? Call Us.
Contact Us Today