Personal Wealth Management / Market Analysis
Why We Don’t Think the Bank of England’s Asset Purchase Programme Is a Net Benefit
As the Bank of England expands quantitative easing, we revisit the programme’s apparent flaws.
As England re-enters lockdown, policymakers are responding quickly with economic assistance. A week ago, the Treasury extended its furlough scheme, which replaces a chunk of workers’ lost wages, and other support programs.[i] Also on that day, the Bank of England (BoE) unleashed a fresh wave of quantitative easing (QE)—through which they purchase long-term gilts from commercial banks in hopes of reducing long-term interest rates and boosting lending.[ii] Yet according to our research, over a decade’s worth of economic data suggest QE hurts economies more than it helps and isn’t rocket fuel for markets. We don’t think more QE is likely to prevent an economic recovery or derail equity markets, but in our view, it is a headwind that investors benefit from being aware of.
As the BoE explains, QE’s goal is to stimulate lending by reducing household and business borrowing costs and giving banks more liquidity.[iii] As implied by the BoE’s name for QE, the Asset Purchase Programme, monetary institutions purchase long-term assets from commercial banks, crediting them with new bank reserves in exchange. The BoE plans to buy an additional £150 billion worth of UK gilts between now and the end of 2021.[iv] Having that big of a buyer purchase that much supply likely drives gilt prices up and yields down, as the two always move in opposite directions. Since sovereign yields generally influence the rates banks charge on loans, the conventional thinking goes, reduced borrowing costs should drive demand for loans, whilst the added reserves increase banks’ ability to lend, boosting loan growth and stimulating economic activity. That, at least, is the popular theory.
But since the BoE, US Federal Reserve (Fed) and other monetary institutions began broadly experimenting with QE in 2009, reality hasn’t quite matched the theory, in our view. Rather, we think there is a large volume of data showing QE doesn’t work as commonly thought. For one, when a monetary institution lowers long rates whilst pegging short rates near zero, it flattens the yield curve—a graphical representation of a single issuer’s interest rates across all maturities. Generally, banks borrow at short-term rates, lend at long-term rates and profit off the spread, which is known in the banking industry as the net interest margin—the potential profit on new loans. Therefore, our research indicates the yield curve usually exerts a large influence on loan profitability, which in turn influences banks’ incentive to lend. Since banks normally create most new money through lending, when loan growth sags, the BoE’s trove of historical data indicates it typically weighs on broad money supply growth, robbing the economy of new fuel for investment and spending.
Most lending decisions involve balancing risk and reward. When lending is more profitable, there is often more reward for risk, which tends to broaden the pool of eligible borrowers. But when profits are smaller, it tends to sap the incentive to lend to all but the most creditworthy—those with the wherewithal to repay all their financial obligations. We think this explains why America’s Senior Loan Officer Opinion Surveys (measures of banks’ willingness to lend) showed banks broadly tightening credit standards during the 2009 – 2020 US economic expansion’s first several years.[v] In our view, this is because the Fed’s QE had flattened America’s yield curve.
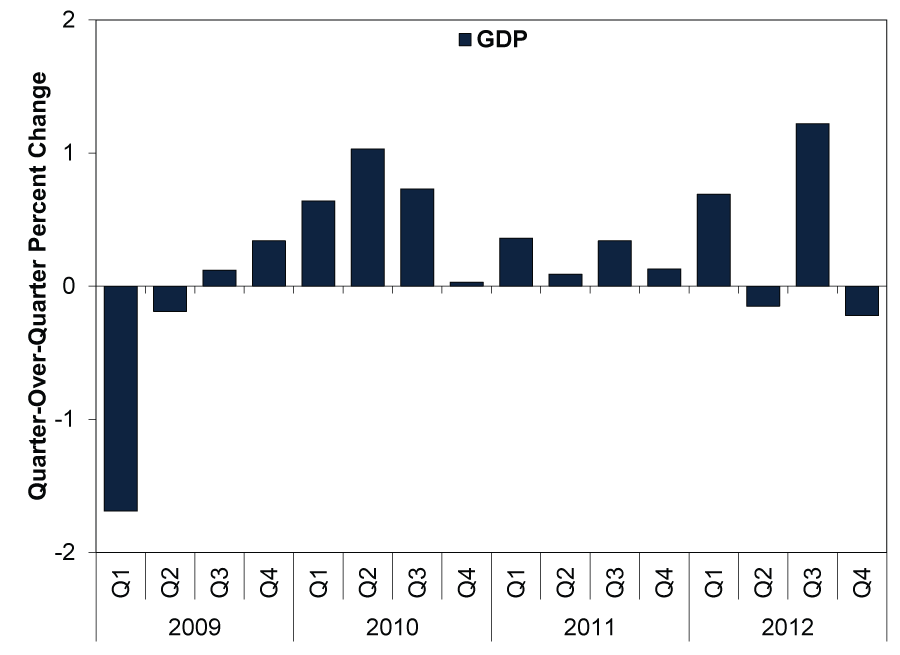
Beyond theory, consider the data during the UK’s prior QE programme, which ran from January 2009 to November 2012. During this time, the BoE quadrupled its balance sheet to £400 billion.[vi] But in the process, the yield curve flattened (Exhibit 1), causing lending and broad money supply to shrink (Exhibit 2), which in turn weighed on GDP growth (Exhibit 3), in our view. After QE stopped, loan and money supply growth began to recover.[vii] GDP accelerated.[viii]
Exhibit 1: The Yield Curve Flattened Under QE
Source: FactSet, as of 11/11/2020. 10-year gilt yield minus Bank Rate, January 2009 – November 2012.
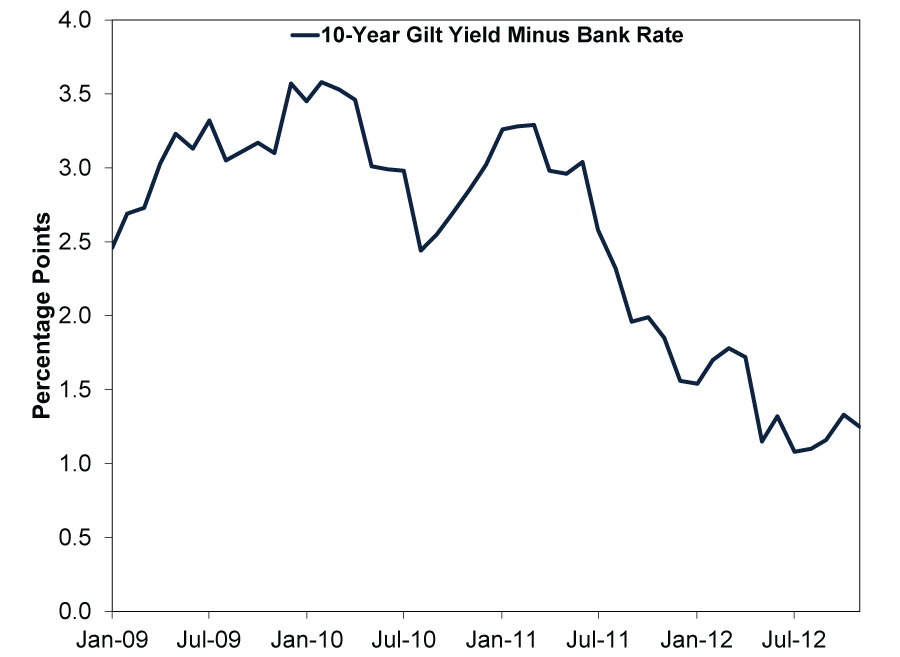
Exhibit 2: Loan and Money Supply Growth Turned Negative
Source: FactSet, as of 11/11/2020. UK net lending excluding securitisations to private sector and M4 money supply, January 2009 – November 2012.
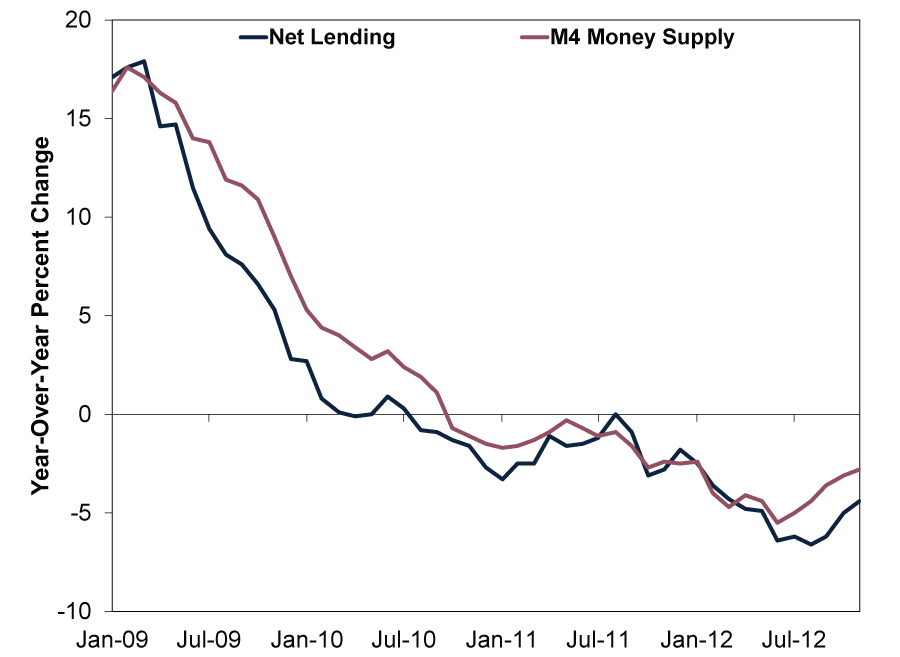
Exhibit 3: GDP Slowed to a Crawl
Source: FactSet, as of 11/11/2020. UK GDP, Q1 2009 – Q4 2012.
Data show the same occurred after the Fed and ECB tapered and then ended their QE programmes. In 2013, the Fed began slowing its asset purchases, stopping them in October 2014.[ix] The US yield curve steepened in 2013 as the market digested the Fed’s allusions to reducing QE. Loan and money supply growth rose sharply, and GDP picked up in 2014.[x] Our research indicates the eurozone experienced similar results in 2016 – 2018 when the ECB reduced and then ended its QE.[xi] US and eurozone equities rose as QE wound down and after it ended.[xii]
Although we think QE is a headwind, it probably isn’t a huge negative. As the last decade showed, in our view, it may slow growth, but it doesn’t sink economies altogether. Also, lower long-term interest rates tend to cut government’s debt service costs, which in the UK’s case should help keep debt affordable even as it hits peacetime highs as a share of GDP.[xiii] But we don’t view QE as a good reason to expect a massive acceleration in economic data or financial market returns. In our view, equity markets rise despite QE, not because of it.
[i] “Sunak to Extend Furlough Scheme to End of March,” Staff, BBC, 5/11/2020.
[ii] “Bank Rate Held at 0.1% and Asset Purchases Increased by £150bn - November 2020,” Staff, BoE, 5/11/2020.
[iii] “What Is Quantitative Easing?” Staff, BoE, 5/11/2020.
[iv] See note ii.
[v] “Getting More from the Senior Loan Officer Opinion Survey?” Donald P. Morgan and John Sporn, Liberty Street Economics, 22/2/2017.
[vi] Source: BoE, as of 11/11/2020. Total BoE assets, January 2009 – November 2012.
[vii] Source: FactSet, as of 11/11/2020. UK net lending excluding securitisations to private sector and M4 money supply, December 2012 – December 2013.
[viii] Ibid. UK GDP, Q1 2012 – Q4 2013.
[ix] “FOMC Statement,” Staff, Federal Reserve, 29/10/2014.
[x] Source: Federal Reserve Bank of St. Louis and Center for Financial Stability, as of 11/11/2020. 10-year Treasury yield minus federal funds rate, April 2013 – October 2014, loans and leases in bank credit, all commercial banks, and M4 money supply, January 2014 – December 2014, and US GDP, Q1 2014 – Q4 2014.
[xi] “Monetary Policy Decisions,” Staff, ECB, 13/12/2018.
[xii] Source: FactSet, as of 11/11/2020. Statement based on S&P 500 total return, May 2013 – December 2015, and MSCI EMU Index with net dividends, December 2016 – December 2019.
[xiii] Ibid. Government debt as a percentage of GDP, Q2 2020.
Get a weekly roundup of our market insights.
Sign up for our weekly e-mail newsletter.

You Imagine Your Future. We Help You Get There.
Are you ready to start your journey to a better financial future?

Markets Are Always Changing—What Can You Do About It?
Get tips for enhancing your strategy, advice for buying and selling and see where we think the market is headed next.
Related Resources
-
Market Analysis Why El Niño Doesn’t Necessitate Portfolio Shifts2026-07-02
-
Market Analysis Today in Brexit, Day 3,652: Brexit Turns 102026-06-24
-
Market Analysis Reviewing America’s Q1 Earnings and What Q2 Expectations Say2026-06-23
-
Politics Revolving Door Turns, Uncertainty Starts Falling2026-06-23


Contact Us
Learn why 200,000 clients trust Fisher Investments and its affiliates to manage their money and find out how we may be able to help you achieve your financial goals.
As of 31/03/2026. Includes Fisher Investments and its affiliates.
New to Fisher? Call Us.
Contact Us Today