Personal Wealth Management / Market Analysis
The Dividend Divide
There is a significant gap between dividends’ reality and how many financial commentators we follow envisage them.
With long-term fixed interest yields down modestly from their early-2021’s not-so-high highs, chatter amongst financial commentators we follow has inevitably returned to high-dividend shares as an alternative income generator. Whilst 10-year UK gilts pay a paltry 0.63%, the MSCI World High-Dividend Yield Index boasts a 3.44% yield, spurring an avalanche of headlines like “5 High-Yield Dividend Stocks for Healthy Income” and “6 Dividend Stocks With Big Payouts and Less Risk.”[i] What better time, in our view, to explain why high-dividend shares generally aren’t the magic solution to all your investing dilemmas?
Dividends have long had the reputation as steady workhorses that churn out reliable payments whilst avoiding the brunt of the equity market’s occasional declines. If we were to hazard a guess, we would posit that this stems from days gone by, when dividend cheques came in the mail, there was no CNBC or Internet, and tracking share prices generally required a daily perusal of your newspaper’s Business section. That took deliberate effort, whereas the cheques just showed up, perhaps giving the perception of stability.
It is a quaint, comforting image—and in our view, wrong. We like dividends! But they aren’t special. They don’t add to returns. They aren’t even a return on your investment—they are a return of your investment. Every time a company pays a dividend, the exact amount in pounds is removed from the share price. The company is basically slicing off a small piece of its total value and sending it to shareholders. It can be hard to see due to market volatility, but by rule, every time a company pays a £1 dividend, the share price falls by £1.
We do think dividends are an important piece of total return, and part of the reason is the cash payout itself. However, the reinvestment of that cash and the subsequent return on it matters much more, in our view. That is what total return is: Price movement plus reinvested dividends. Accordingly, to accurately compare high-dividend payers and the broader equity market, we think investors must tune down their biases and objectively compare their total returns.
Do so, and you will see high dividend-paying shares aren’t inherently superior to other shares, as the following graphs demonstrate. Forgive the tautology, but shares are shares, period. They are all volatile from day to day, week to week, month to month and year to year. Bear markets hit high-dividend shares and low- or no-dividend shares alike. (A bear market is a deep, typically lasting, broad equity market decline of -20% or worse with an identifiable fundamental cause.) As the charts illustrate, sometimes high-dividend payers outperform the broader market. Sometimes they don’t. As Exhibit 1 shows, high-dividend payers have trailed the broader market quite badly since 2020 began, with the outperformance during last year’s short bear market a brief countertrend. Lest you think high-dividend shares have special bear market powers, however, consider Exhibit 2, which compares high-dividend and broad developed equity markets since daily data begin at the end of 2000—high-dividend shares took a disproportionate beating during the bear market that accompanied the global financial crisis in 2007 – 2009. That is also when several high dividend-paying Financials companies cut payouts. In other words, dividends and safety aren’t synonymous.
Exhibit 1: High-Dividend Payers Have Had a Rocky Stretch
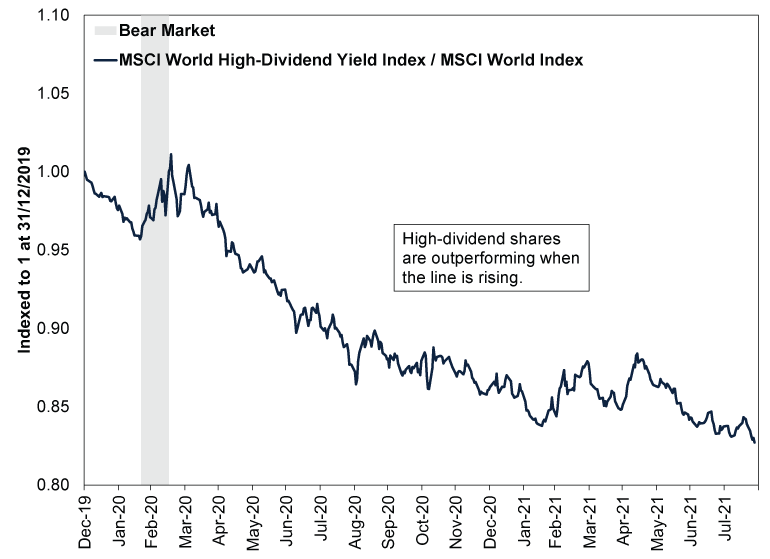
Source: FactSet, as of 30/8/2021. MSCI World and MSCI World High-Dividend Yield Index returns with net dividends, 31/12/2019 – 27/8/2021. Indexed to 1 at 31/12/2019.
Exhibit 2: Make That a Rocky Decade?
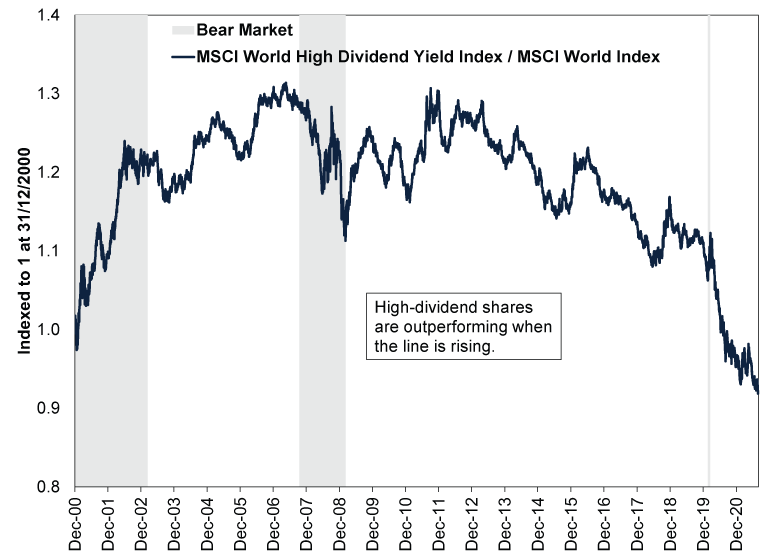
Source: FactSet, as of 30/8/2021. MSCI World and MSCI World High-Dividend Yield Index returns with net dividends, 31/12/2000 – 27/8/2021. Indexed to 1 at 31/12/2000.
High-dividend payers’ underperformance doesn’t mean they are inherently inferior. But neither are they inherently superior. They simply tend to have different categorical weights and concentrations in terms of geography, sector and style. Style refers to the categorisations known as value and growth. Value-orientated companies tend to carry relatively lower price-to-earnings ratios and more debt, making them more sensitive to economic conditions, and they tend to return more money to shareholders via dividends and share buybacks and invest less in growth-orientated endeavours. By contrast, growth-orientated companies generally have higher valuation metrics like price-to-earnings ratios and focus on re-investing profits into the core business to expand over time, making their profits relatively less sensitive to economic ups and downs, according to our research.
As Exhibit 3 shows, compared to the MSCI World Index, high-dividend shares are significantly underweight to the US and overweight Europe and the UK. This is largely because, as Exhibit 4 shows, the high-dividend realm is very light on Tech and Tech-like shares and overexposed to Utilities, Health Care and Consumer Staples. These are all defensive- and value-heavy areas, making a high-dividend portfolio basically a play on defensive-and-value orientated shares. Over the past 20 years, the MSCI World High-Dividend Yield Index’s return relative to the MSCI World Index has a correlation of 0.51 with the MSCI World Value Index’s return relative to the MSCI World Growth Index.[ii] The correlation coefficient is a statistical measure of how often two variables move together. A correlation of 1 is identical movement and -1 is polar opposite, so a 0.51 correlation means high-dividend and value shares outperform in tandem much more often than not. That works out well when value does well, but not when growth is leading—and growth has led for the past few years.[iii]
Exhibit 3: High-Dividend Paying Shares Are Biased Toward Value-Heavy Countries …
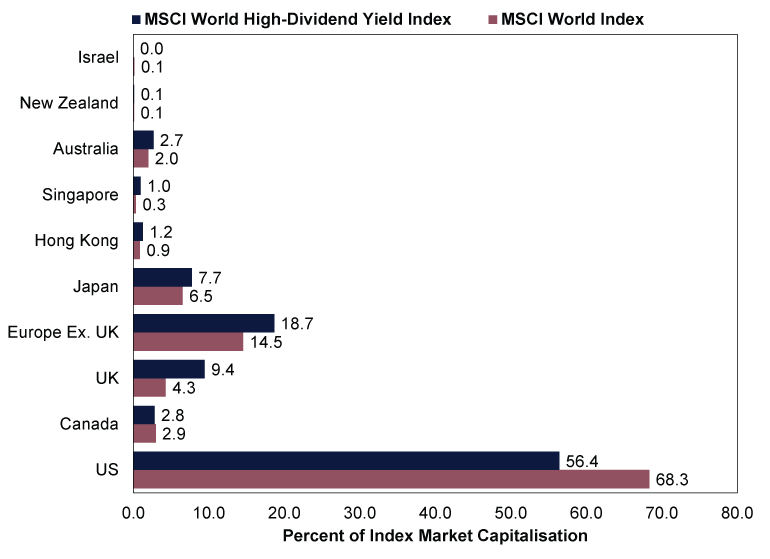
Source: FactSet, as of 30/8/2021. MSCI World High-Dividend Yield and MSCI World Index country weightings on 27/8/2021.
Exhibit 4: … And Value-Heavy Sectors

Source: FactSet, as of 30/8/2021. MSCI World High-Dividend Yield and MSCI World Index sector weightings on 27/8/2021.
Accordingly, we encourage investors seeking to support themselves with their retirement portfolio to change their frame of reference when thinking about how to generate money from their investments. In our experience, many people think only of portfolio income, e.g., dividends and interest—a very limiting mindset. We think it is more beneficial to think in terms of simple cash flow instead—in other words, the total amount you need to withdraw each month or year. Then give yourself an array of options to generate that cash, including selling securities—a tool we call homegrown dividends. When you approach it this way, then it becomes much less about yield and much more about the rate of return you will need in the long run to minimise the likelihood of outliving your assets. You can manage for total return and capitalise on broad sector, country and style trends without being limited by one arbitrary variable.
If that sometimes includes a gaggle of high-dividend payers, great! But we suggest readers consider that a happy side effect and not get too attached.
[i] Actual headlines from Kiplinger and Barron’s. Oh and the data here are from FactSet, as of 9/9/2021. 10-year UK gilt yield and MSCI World High-Dividend Yield Index dividend yield on 9/9/2021.
[ii] Source: FactSet, as of 30/8/2021. MSCI World High-Dividend Yield Index, MSCI World Index, MSCI World Value Index and MSCI World Growth Index returns with net dividends, 31/8/2001 – 27/8/2021. Correlation calculation uses weekly change in MSCI World High-Dividend Yield Index / MSCI World Index and MSCI World Value Index / MSCI World Growth Index, all indexed to 1 at 31/8/2001.
[iii] Source: FactSet, as of 30/8/2021. Statement based on MSCI World Growth and Value Index returns with net dividends.
Get a weekly roundup of our market insights.
Sign up for our weekly e-mail newsletter.

You Imagine Your Future. We Help You Get There.
Are you ready to start your journey to a better financial future?

Markets Are Always Changing—What Can You Do About It?
Get tips for enhancing your strategy, advice for buying and selling and see where we think the market is headed next.
Related Resources
-
Macro Insights Q1 2026 Global Markets Review & Outlook2026-05-12
-
Macro Insights Why Global Small Cap2026-05-07
-
Market Analysis What to Think of Another Aussie Rate Hike2026-05-05
-
Market Analysis Europe’s Resilient Q1 GDP2026-05-01


Contact Us
Learn why 200,000 clients trust Fisher Investments and its affiliates to manage their money and find out how we may be able to help you achieve your financial goals.
As of 31/03/2026. Includes Fisher Investments and its affiliates.
New to Fisher? Call Us.
Contact Us Today