Personal Wealth Management / Market Analysis
What Now, GDP Nowcast?
Purported real-time GDP trackers get heaps of attention from commentators we follow, but their models aren’t airtight.
Bear markets—typically gruelling stock market declines of -20% or worse with fundamental causes—often precede recessions.[i] Not always, but often. So when US stocks breached -20% on 13 June in US dollars, recession chatter hotted up amongst commentators we follow globally.[ii] Given US gross domestic product (GDP, a government produced measure of economic output) accounts for nearly a quarter of global GDP and US stocks represent nearly 70% of the MSCI World Index market capitalisation, the focus is understandable—troubles in America have a history of spilling over into the rest of the world.[iii] So a lot of attention is turning to the tools that look to forecast US recessions, including the US Federal Reserve (Fed) Bank of Atlanta’s GDPNow—a statistical model designed to estimate the quarter’s GDP based on incoming data and forecasts. This so-called nowcast fell to -2.1% annualised for Q2 on 1 July—prompting further recession warnings.[iv] Whilst we don’t dismiss the possibility of a Q2 contraction, which would technically be the second-straight quarterly decline, we think there are reasons to be sceptical this outcome is assured. Or that it means America would be in recession.
The Atlanta Fed’s tool is one of several like it that aggregate incoming data, apply mathematical modelling and try to predict the US’s eventual GDP release. It mashes together Fed forecasts and actual US economic data releases, evolving throughout the quarter as data arrive. It also, the Atlanta Fed’s website stresses, isn’t the bank’s official forecast. It is a research exercise above all else, based largely on ideas cooked up in the private sector.
As you might imagine, the earlier in the quarter one looks at GDPNow, the less accurate the nowcast tends to be. But even at quarter end, when most data are in, deviation from the final result (otherwise known as tracking error) exists. And it is up since the pandemic. (Exhibit 1) That doesn’t mean we think GDPNow is wrong or useless. It just means we think investors should handle it with caution because, like all economic data, it is far from perfect—especially given the oddity of 2020’s lockdown-driven downturn.[v] Exhibit 1 shows GDPNow’s historical tracking error on the day before the US Bureau of Economic Analysis published the relevant quarter’s advance GDP estimate. (This quarter, that would be on 27 July.)
Exhibit 1: Tracking Error on Eve of Release Up Since Pandemic
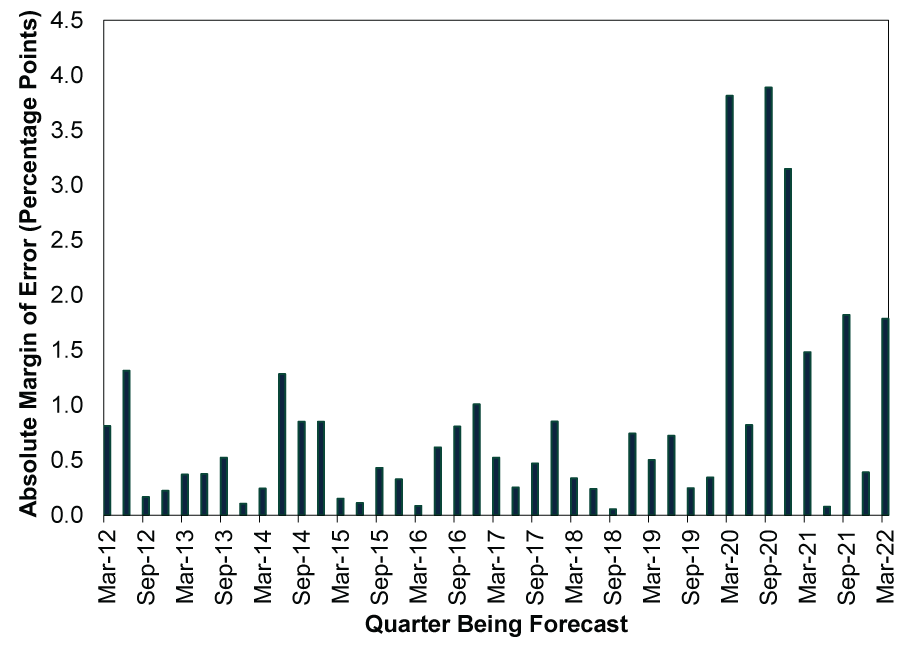
Source: Federal Reserve Bank of Atlanta, as of 6/7/2022. Absolute margin of error refers to the difference between the growth rates included in the nowcast’s projection and the Bureau of Economic Analysis’ initial GDP estimate.
Now, that is the absolute error—the magnitude of the difference, not the direction—meaning that skew doesn’t necessarily mean the US’s actual GDP result will exceed GDPNow’s eventual prediction on 27 July. Actually, GDPNow has more often overstated than understated the outcome, but that isn’t assured and the dataset is really small.[vi] We simply think it is an error to take nowcasts—which will evolve from here as more data arrive—to the bank.
We think the methodology largely explains the skew. For example, 1 July’s -1.1 percentage point drop to the nowcast’s contraction is mostly underpinned by a reduction in the estimate of Q2 real personal consumption expenditures (PCE) from 1.7% annualised to 0.8%.[vii] That wasn’t due to an actual report on PCE, though. It is imputed from the Institute for Supply Management’s Manufacturing Purchasing Manager Index (a monthly survey that tracks the breadth of economic activity; readings above 50 indicate expansion, below 50, contraction). We are sure the Atlanta Fed has its statistical logic for doing so, but in a period when US consumer spending has been shifting from goods to services bigtime, that seems potentially problematic, in our view.[viii]
Again, we aren’t saying this tool is wrong or useless. We aren’t siding with the St. Louis Fed’s Economic News Index nowcast, which currently projects 3.9% annualised growth.[ix] Nor are we suggesting these bodies follow the New York Fed’s lead and pause their nowcasts, pending recalculation and methodology changes post-pandemic. All data have their limitations, and we think these nowcasts helpfully aggregate things for investors to consume.
Still, maybe the Atlanta Fed’s gauge is right and we do get another quarterly contraction. Some commentators we follow would likely call that a recession. (Of course, America doesn’t define a recession as two straight quarters of negative GDP. The fun analysts at the National Bureau of Economic Research’s Business Cycle Dating Committee determine when the US is in one—at a long lag.) But you can find recession chatter on virtually every financial publication anywhere quite easily and prominently. That suggests to us that the risk of recession is factored into markets to a very large extent today. In our view, it would take quite a lot to negatively shock stocks for long now.
[i] Source: FactSet, as of 8/7/2022. Statement based on S&P 500 Index price returns in USD and American recession dating from the National Bureau of Economic Research’s Business Cycle Dating Committee. US market returns and recession dates used in lieu of global due to the longer available dataset. Currency fluctuations between the dollar and pound may result in higher or lower investment returns.
[ii] Source: FactSet, as of 7/7/2022. Statement based S&P 500 total return in US dollars. Currency fluctuations between the dollar and pound may result in higher or lower investment returns.
[iii] FactSet and the World Bank, as of 7/7/2022. Statement based on US GDP as a percent of global GDP through 2021 and US market capitalisation as a percentage of MSCI World Index market capitalisation. Market capitalisation is a measure of a firm or equity market’s size, calculated by multiplying share price times shares outstanding.
[iv] “GDPNow,” Federal Reserve Bank of Atlanta, 1/7/2022. Annualised GDP figures refer to the rate at which GDP would grow or shrink over a full year if the quarter-over-quarter growth rate repeated for four quarters.
[v] Source: US Bureau of Economic Statistics, as of 8/7/2022. Statement based on quarterly GDP and its breakdown throughout 2020 and 2021.
[vi] “Challenges in Nowcasting GDP Growth,” Federal Reserve Bank of Atlanta, 12/5/2020.
[vii] Source: Federal Reserve Bank of Atlanta, as of 6/7/2022.
[viii] Source: US Bureau of Economic Analysis, as of 8/7/2022. Statement refers to inflation-adjusted personal consumption expenditures by major types of product, 31/12/2019 – 31/5/2022.
[ix] Source: Federal Reserve Bank of St. Louis, as of 6/7/2022.
Get a weekly roundup of our market insights.
Sign up for our weekly e-mail newsletter.

You Imagine Your Future. We Help You Get There.
Are you ready to start your journey to a better financial future?

Markets Are Always Changing—What Can You Do About It?
Get tips for enhancing your strategy, advice for buying and selling and see where we think the market is headed next.
Related Resources
-
Environmental, Social and Governance Insights Responsible Investment Newsletter 20262026-03-11
-
Economics Pain at the Petrol Station Won’t Hurt the Global Economy2026-03-11
-
Market Analysis February’s Growthy Data—and the Iran War’s Souring Sentiment2026-03-06
-
Market Analysis Putting the Latest Private Credit Implosion in Perspective2026-03-06


Contact Us
Learn why 195,000 clients trust Fisher Investments and its affiliates to manage their money and find out how we may be able to help you achieve your financial goals.
As of 31/12/2025. Includes Fisher Investments and its affiliates.
New to Fisher? Call Us.
Contact Us Today