Personal Wealth Management / Market Analysis
Why We Don’t Think High Valuations Signal a Dim Future
Our research shows that valuations just don’t tell you much about future returns—in the near term or long run.
Globally, headlines we follow tout historically high valuations, measures comparing share prices to fundamental metrics like earnings or sales, as a negative allegedly frothy markets are overlooking. This is particularly true in America, where price-to-earnings (P/E) ratios show markets are at their most expensive since 2000’s dot-com bubble, supposedly foretelling poor returns.[i] Some claim this is about returns immediately ahead—and that a bear market (a typically long, fundamentally driven decline exceeding -20%) may lurk around the corner.[ii] We see others arguing it refers to lower-than-average returns over the long-run future. But to us, this implies valuations are predictive. We think history shows you otherwise, a lesson worth taking note of now.
P/Es come in various flavours depending chiefly on the earnings denominator. Some use the past 12 months’ earnings. Others include those hinging on analysts’ 12-month forward earnings estimates or the, bizarrely distorted in our view, cyclically adjusted P/E (CAPE), which employs a 10-year average of inflation-adjusted earnings. But lately, it is the first—the so-called trailing P/E—fearful headlines we read seem to tout.[iii] Using America’s S&P 500 equity index for its long history, according to data from Global Financial Data, Inc., its trailing 12-month P/E is presently hovering around 35—in the top 3% of readings since 1926.[iv] Whilst UK P/Es are far lower at 18.8, this is still high for British markets, which are value-orientated and tend to trade at lower valuations as a result.[v] Sound alarming? We don’t think so. Here is why.
For one, last year’s lockdown-skewed quarterly results are still influencing the calculation.[vi] According to our analysis, the destruction of firms’ profits last year plus the steep rally in equities—which anticipated better corporate results ahead tied to reopening—inflated P/Es massively. We think this also explains why the current level (35.3) is actually down from June’s peak (45.7)—Q2’s blockbuster earnings helped.[vii] The same holds in Britain, where P/Es touched 35.9 at 2020’s close but have retreated since, tied to earnings’ recovery.[viii] But the current trailing 12-month P/E valuation still includes depressed earnings in Q3 and Q4.[ix] Against this backdrop, we don’t think it is abnormal for valuations to seem elevated.
Another disconnect, in our view, is in the purported relationship between valuations and subsequent returns some commentators we follow claim. Our research shows there is none. Take Exhibit 1, which maps trailing P/Es and their price return one year later.
Exhibit 1: 1-Year S&P 500 Return Versus P/E Ratio, 1926 – 2020
Source: Global Financial Data, Inc., as of 9/9/2021. S&P 500 trailing 12-month P/E, monthly, and subsequent rolling 12-month price returns, December 1925 – August 2020. Presented in US dollars. Currency fluctuations between the dollar and pound may result in higher or lower investment returns. See our annex for a five-year chart of this index through the publication date.
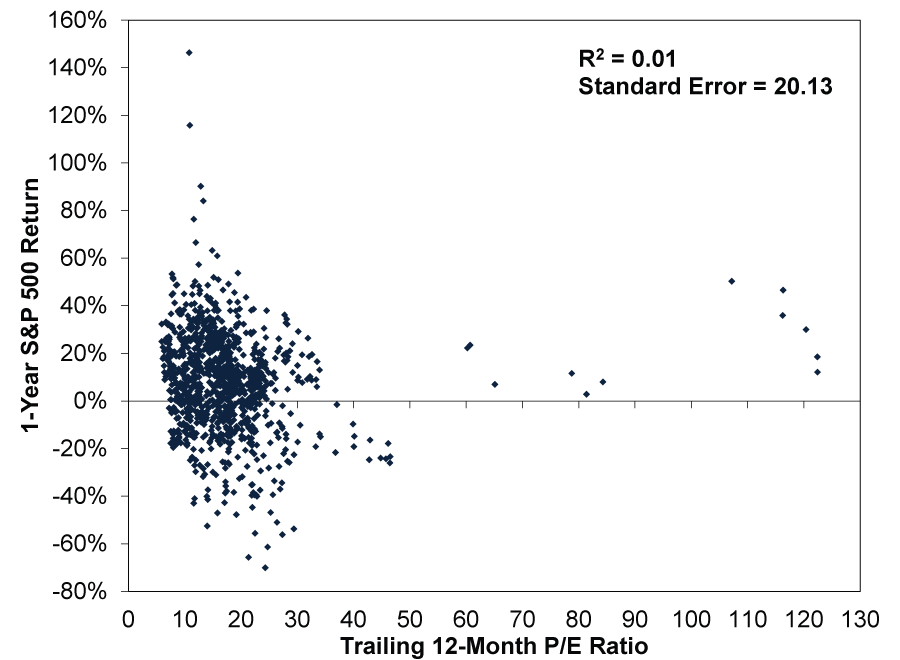
We think this looks scattershot because it is. There are relatively few months of 35 or higher, clustered into two time periods: One follows 2000’s Tech bubble, and returns 12 months from those instances were bad.[x] The other is the aftermath of 2008’s financial crisis where returns in the ensuing 12 months were strongly positive.[xi] In our view, those basically offset. But even if we water this down to get more data points, there seems little identifiable relationship. For example, at around 25 times trailing earnings—far higher than the index’s 16.4 historical median—there are about as many dots above 0% as below.[xii] A high (or low) P/E doesn’t appear to reliably tell you where equities will go over the next year.
In statistics, a measure known as R2, which tells you how much the P/E ratio explains the next 12 months’ returns, helps to capture this non-correlation. A near-zero reading, like in Exhibit 1, indicates valuations explain almost no aspect of forward market returns, while a reading of 1 would indicate valuations completely explain them. Standard error is a measure of the statistical accuracy of an estimate. In this case, there is a 68% likelihood equities’ one-year return is within plus or minus 20.13 percentage points of the average return for any given P/E.[xiii] We think that is a very wide range—scattershot.
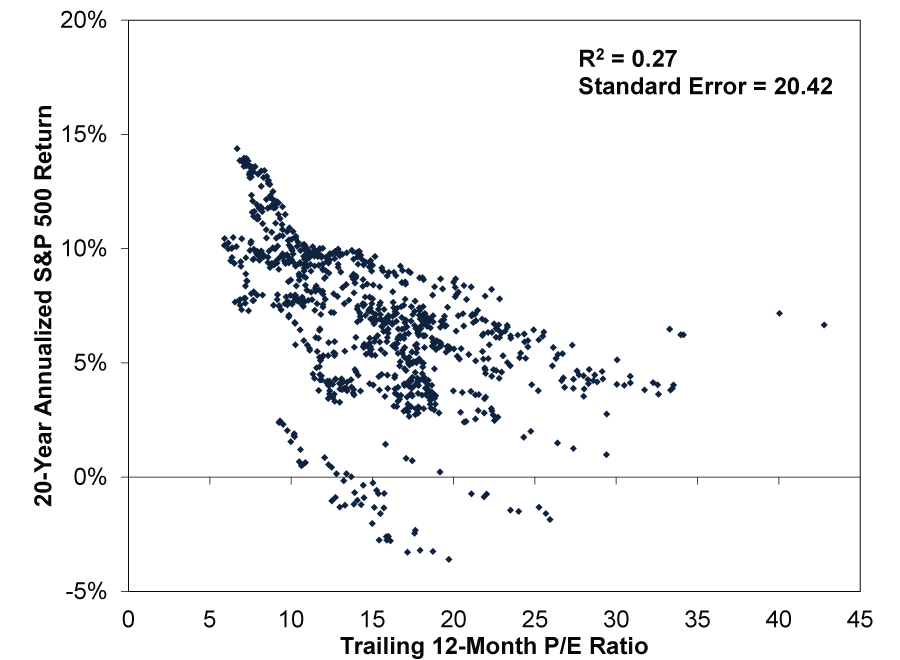
The same goes for the longer term, in our view: P/Es don’t foretell distant future returns, either. Their ability to predict returns years away are about as scattershot. (Exhibit 2) On longer time frames, our research reveals the best forecasting job P/Es have done is around a 20-year time horizon, where equities’ future returns correlate with P/Es 27% of the time—an R2 of 0.27—a weak relationship. Statisticians generally require an R2 above 0.70 to determine that a relationship has statistical significance. Note Exhibit 2’s standard error for P/E’s ability to pinpoint 20-year annualised returns—the yearly rate required to reach its ending value from inception—remains very wide. Now, if you squint a little, we think you may see Exhibit 2 does show lower trailing P/Es corresponding slightly with higher annualised returns. However, the chart shows high P/Es can still deliver very good 20-year appreciation. Note, too: Over 30-year time horizons, returns are all positive.[xiv]
Exhibit 2: 20-Year Annualised S&P 500 Return Versus P/E Ratio, 1926 – 2001
Source: Global Financial Data, Inc., as of 9/9/2021. S&P 500 trailing 12-month P/E, monthly, and subsequent rolling 20-year annualised price returns, December 1925 – August 2001. Presented in US dollars. Currency fluctuations between the dollar and pound may result in higher or lower investment returns. See our annex for a five-year chart of this index through the publication date.
Why doesn’t valuation drive markets? In our view, it is because most valuation measures—like trailing P/Es, CAPE, price-to-sales ratios, dividend yields and market capitalisation to GDP, for example—are backward looking. Even forward P/Es are based on estimates made at a given point in time. In our experience, they often prove too low, inflating P/Es. Moreover, we think all are widely known, as valuations are amongst the most commonly taught investment analytics tools. Too many people using them mitigates their effectiveness, in our view.
What moves forward-looking markets most, in our view, is the gap between reality and expectations. At best, we think valuations give a sense of sentiment—a coincident indicator of what investors are willing to pay for expected future earnings. Now, if you had spiking valuations the public either was ignoring or explaining away, that could be a troubling sign. But from the commentary we follow, we have the opposite now, and that suggests to us markets are likely to keep climbing.
Annex: S&P 500 Index, 9/9/2016 – 9/9/2021
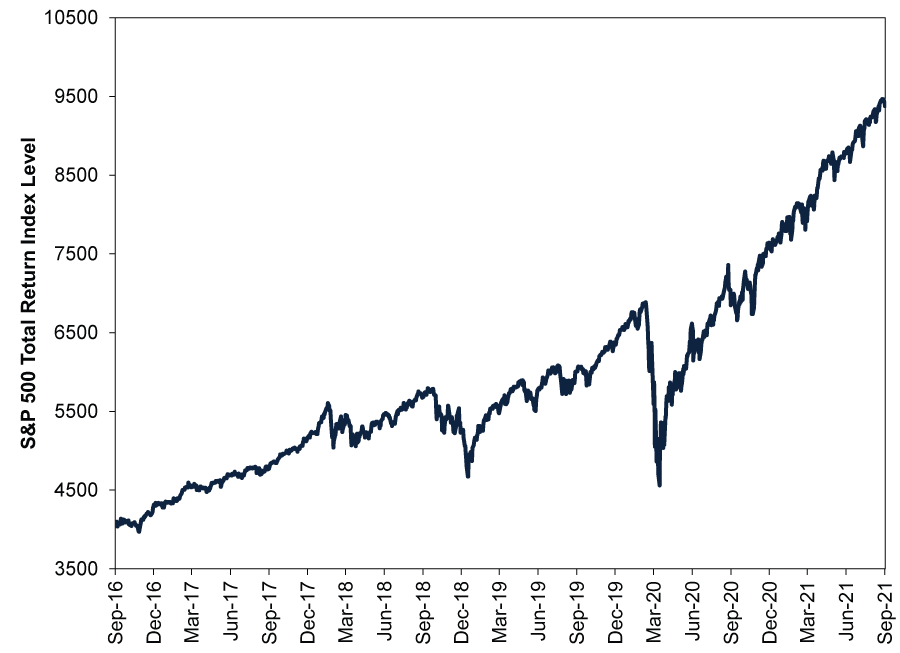
Source: FactSet, as of 10/9/2021. S&P 500 Total Return Index level, 9/9/2016 – 9/9/2021. Presented in US dollars. Currency fluctuations between the dollar and pound may result in higher or lower investment returns.
[i] “Tech Growth Comes at Irrational Price,” Edward Chancellor, Reuters, 9/9/2021.
[ii] “The US Is in One of the Greatest Bubbles in Financial History,” Merryn Somerset Webb, MoneyWeek, 3/9/2021.
[iii] “Why We Are Not at the Start of a New Bull Market,” David Rosenberg, Financial Post, 20/8/2021.
[iv] Source: Global Financial Data, Inc., as of 9/9/2021. S&P 500 trailing 12-month P/E, monthly, December 1925 – August 2021.
[v] Source: FactSet, as of 10/9/2021. MSCI UK IMI P/E, 31/1/2003 – 31/8/2021 (full history).
[vi] Source: FactSet, as of 9/9/2021. S&P 500 trailing 12-month earnings, Q3 2020 – Q2 2021. Presented in US dollars. Currency fluctuations between the dollar and pound may result in higher or lower investment returns.
[vii] Source: Global Financial Data, Inc., as of 9/9/2021.
[viii] Source: FactSet, as of 10/9/2021. MSCI UK IMI P/E on 31/12/2021.
[ix] Ibid.
[x] Source: Global Financial Data, Inc., as of 9/9/2021. S&P 500 trailing 12-month P/E, monthly, and subsequent rolling 12-month price returns, December 1925 – August 2020. Presented in US dollars. Currency fluctuations between the dollar and pound may result in higher or lower investment returns.
[xi] Ibid.
[xii] Ibid. Median S&P 500 trailing 12-month P/E, monthly, December 1925 – August 2021.
[xiii] “Standard Error,” Staff, ChangingMinds.org, retrieved on 9/9/2021.
[xiv] Source: Global Financial Data, Inc., as of 9/9/2021. S&P 500 trailing 12-month P/E, monthly, and subsequent rolling 30-year annualised price returns, December 1925 – August 1991. Presented in US dollars. Currency fluctuations between the dollar and pound may result in higher or lower investment returns.
Get a weekly roundup of our market insights.
Sign up for our weekly e-mail newsletter.

You Imagine Your Future. We Help You Get There.
Are you ready to start your journey to a better financial future?

Markets Are Always Changing—What Can You Do About It?
Get tips for enhancing your strategy, advice for buying and selling and see where we think the market is headed next.
Related Resources
-
Politics Blunting Burnham?2026-07-22
-
Economics Don’t Doubt the Old World2026-07-17
-
In The News Thinking of investing in an IPO? Read my golden rule first2026-07-16
-
Politics Long-Term Forecasts and Court Verdicts: The Latest in British and French Politics2026-07-14


Contact Us
Learn why 210,000 clients trust Fisher Investments and its affiliates to manage their money and find out how we may be able to help you achieve your financial goals.
As of 30/06/2026. Includes Fisher Investments and its affiliates.
New to Fisher? Call Us.
Contact Us Today