Personal Wealth Management / Market Analysis
Will Energy’s Q1 Boom Keep Gushing?
Energy shares face underappreciated headwinds going forward, in our view.
Energy shares surged late last year and in Q1, outperforming all sectors with a 20.7% gain.[i] Fuelling Energy’s rise, according to many financial headlines we cover: Oil demand is improving whilst significant producers continue to hold back supply. That combination sent Brent crude oil prices (the common global oil price benchmark) up 24.0% in the quarter and 32.9% through 7 May, adding to enormous gains since April 2020’s low—a solid tailwind for Energy firms’ profitability and relative returns.[ii] Now many experts we follow see increasing oil demand from further economic reopenings, falling inventories and constrained supply as a sign more outperformance lies ahead. To us, that seems unlikely. We think prices largely reflect the chief, well-known tailwinds, whilst extant headwinds seem underappreciated. For long-term investors, some exposure to the sector is likely beneficial from a diversification standpoint, but its early leadership doesn’t look likely to persist, in our view.
We think it is worthwhile to revisit the backdrop for oil’s outperformance this year to provide context. Energy’s run followed a disastrous 2020 as COVID lockdowns crushed oil demand, causing oil prices to collapse. Accordingly, Energy companies faced steep losses, and the sector tumbled -50.7% from world markets’ pre-pandemic high to the sector’s 18 March 2020 low.[iii] Despite the recent surge, Energy share prices remain below pre-COVID levels.
Moreover, the pandemic wasn’t behind all of Energy’s woes, which our research shows are much longer-running. Global Energy underperformed in 8 of the past 11 calendar years (2010 – 2020).[iv]
Exhibit 1: Energy’s Challenges Predate COVID
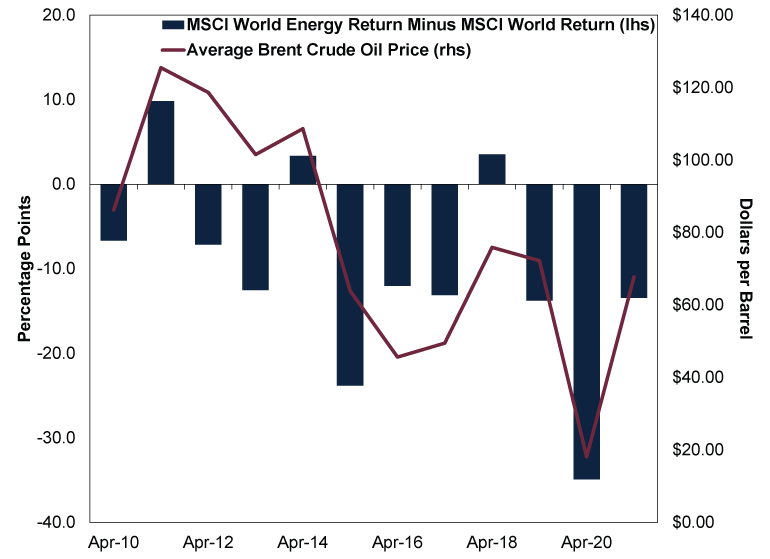
Source: FactSet, as of 7/5/2021. MSCI World Energy Index 12-month return with net dividends minus MSCI World Index 12-month return with net dividends, in GBP, and average 12-month Brent crude oil prices, 30/4/2010 – 30/4/2021. 2021 relative return data are year-to-date. Brent crude is priced in USD.
Huge, structural shifts in oil supply explain most of Energy’s perennial underperformance, in our view. High oil prices before the 2007 – 2009 financial crisis incentivised oil firms to find new sources of oil. The financial crisis put that on pause—temporarily. As oil prices rose swiftly alongside the eventual economic rebound, the incentive to find new sources gained steam anew.
The result? America’s shale oil revolution. Combining existing technologies—advances in hydraulic fracturing and horizontal drilling—US oil producers unlocked vast new crude oil resources. US output began surging around 2012 and hasn’t looked back.[v] Not coincidentally, in our view, Energy’s long-term underperformance trend began in mid-2011, as markets anticipated the shift to an oversupplied market. This particularly gained steam in 2014, when the Organization of the Petroleum Exporting Countries (OPEC) elected to flood the market with supply in an effort to force US shale drillers to cut production in order to boost profitability.[vi] Oil prices halved, and Energy shares, which are highly oil-price sensitive, tanked as well.[vii]
Exhibit 2: The Rise of US Shale Leads to Massive Increases in Output
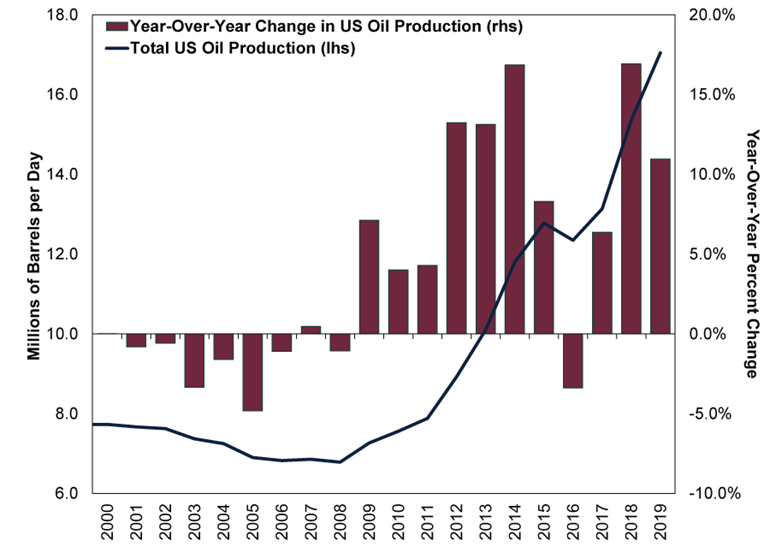
Source: BP, as of 6/5/2021. 2020 Statistical Review of World Energy, World Crude Production Figures, annual change in US oil production, 2000 – 2019. Includes crude oil and natural gas liquids.
By mid-2016, though, prices had bottomed and began recovering. As they did, shale firms ramped up output again. In late 2018, the US became the world’s biggest crude producer.[viii] The modern US shale revolution shifted the oil market from undersupplied—with many financial commentators warning production had potentially peaked—to oversupplied, with many research outfits we monitor commonly claiming demand will soon peak and falter.[ix] COVID’s demand hit—oil consumption fell -9% last year—added to the sector’s woes, although we think that seems temporary.[x]
That is the backdrop entering 2021. But past performance alone won’t tell you about the future, in our view—a fundamental look at demand and supply is more instructive.
Exhibit 3: World Oil Supply and Demand
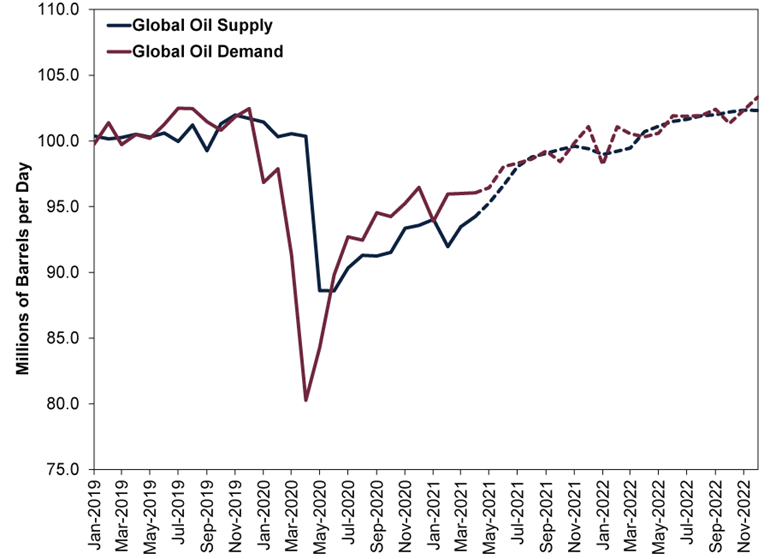
Source: US Energy Information Administration, as of 6/5/2021. April 2021 Short-Term Energy Outlook, OECD and Non-OECD Consumption, OPEC and Non-OPEC Production, January 2019 – April 2019 and forecasts, May 2021 – December 2022.
As Exhibit 3 shows, demand is improving, a relative bright spot now that looks likely to continue throughout 2021. Given it enables more travel and activity in general, the deployment of COVID vaccines is likely positive for oil demand, which the US Energy Information Administration (EIA) expects to rise 6% this year.[xi] However, total world demand remains below its ~100 million barrels per day (mbd) pre-COVID peak.[xii] According to their latest public estimates, neither the EIA nor the International Energy Agency expects a full recovery until late 2022 or early 2023. Of course, demand could return faster than expected. But the tragic persistence of COVID in countries like India and Brazil is a reminder it could also be slower than forecast. Then too, pre-COVID demand wasn’t an excellent environment for Energy shares.
On supply, oil production presently remains below demand, driving prices up and oil inventories down in major nations. This is bullish for Energy companies, and we think it is the primary reason shares have outperformed lately.
Exhibit 4: Increasing Demand, Constrained Supply Resulting in Inventory Drawdowns
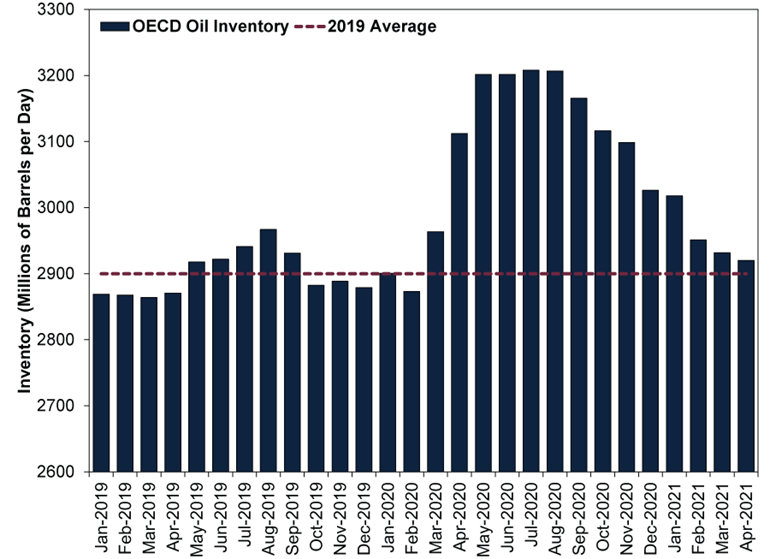
Source: EIA, as of 6/5/2021. April 2021 Short-term Energy Outlook, Organisation for Economic Cooperation and Development Monthly Inventory, January 2019 – April 2021.
But the situation appears tenuous to us. The primary driver of restricted oil supply? Massive production cuts from OPEC+, a super cartel of 23 countries led by Saudi Arabia and Russia representing about 50% of global oil production.[xiii] OPEC+ cut production by a historic 9.7 million barrels per day from pre-pandemic levels.[xiv] Since then, they have returned just 2.5 mbd of the cuts.
OPEC+ now plans to boost production by 2.1 mbd over the next 3 months.[xv] Even after the increase, OPEC+ spare capacity—or sustainable oil production that can come online quickly—remains massive and represents a considerable headwind to prices, according to our research. Whilst OPEC+ compliance has been robust, higher oil prices will likely test its members’ resolve, as many need oil revenue to support their economies. The incentive to pump more above quota increases as prices rise. If America lifts Iranian sanctions, supply could rise even more.
Exhibit 5: A Historically Large Potential Supply of OPEC+ Production Looms
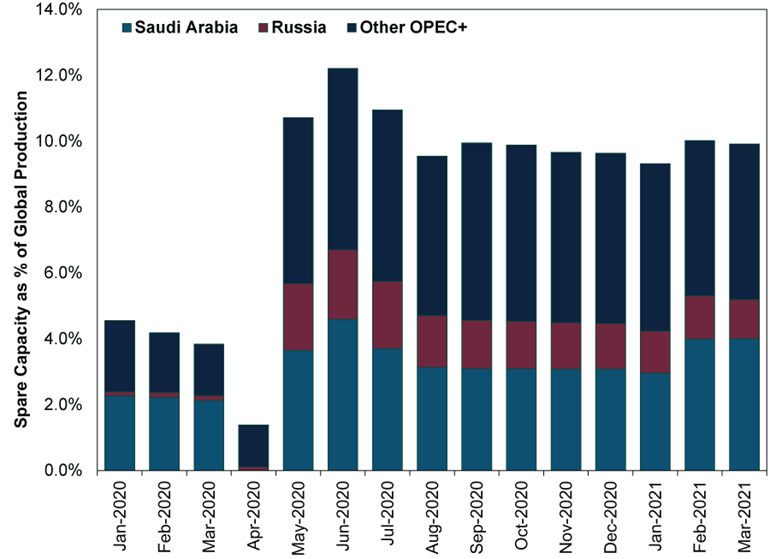
Source: EIA and World Bank, as of 30/4/2021. Monthly OPEC+ Spare Capacity, January 2020 –April 2021.
All that is before you even consider US producers. They have also supported oil prices by holding off on increasing production, choosing instead to invest their free cash flow into paying down debt. Investors rewarded US oil companies’ discipline in Q1. But looking forward, oil prices are now well above the average estimated cost of drilling new wells.
Exhibit 6: US Production Likely Increases With Higher Oil Prices
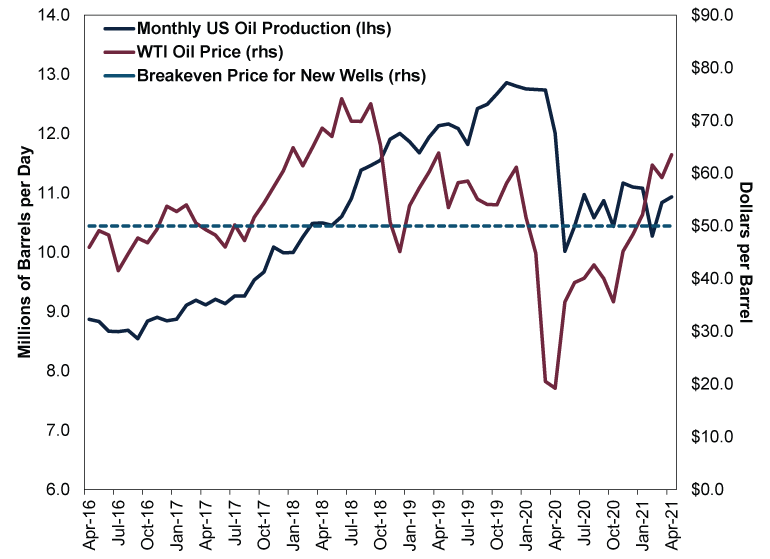
Source: FactSet, Federal Reserve Bank of Dallas and EIA, as of 6/5/2021. Monthly US Crude Production and monthly average West Texas Intermediate crude oil prices, 1/1/2019 – 5/5/2021.
Higher prices are already incentivising more activity. US rig counts and oil well completions are rising, which generally leads to more US oil production.[xvi] As the last decade proves, higher US production can be problematic for other global producers, namely OPEC+. If US production rebounds, OPEC+ may respond by flooding the market again—a source of significant uncertainty, in our view.
Taking demand and supply factors into account, we think the Energy sector and oil producers face conflicting drivers. Whilst the recent rally had fundamental support from recovering economic growth and oil demand tied to reopening, these factors are exceptionally well known—likely sapping their power to sway Energy shares much looking ahead, in our view. The recent rally in the sector likely reflects many of these positives.
Looking forward, we think producer discipline remains a looming question in the face of higher prices. Generally, higher prices have incentivised production, ultimately oversupplying the market. Maybe this time is different. But as Sir John Templeton famously put it, those tend to be the most dangerous words in investing.
[i] Source: FactSet, as of 7/5/2021. MSCI World Energy sector return with net dividends, in GBP, 31/12/2020 – 31/3/2021.
[ii] Source: FactSet, as of 7/5/2021. Brent crude oil price percentage change, 31/12/2020 – 7/5/2021.
[iii] Source: FactSet, as of 7/5/2021. MSCI World Energy sector return with net dividends, in GBP, 20/2/2020 – 18/3/2020.
[iv] Ibid., as of 12/5/2021. MSCI World Index and MSCI World Energy Index annual returns with net dividends, in GBP, 2010 – 2020.
[v] Source: US Energy Information Administration, as of 12/5/2021. US Field Production of Crude Oil, 2012 – 2020.
[vi] “Oil Prices Keep Plummeting as OPEC Starts a Price War With the US,” Brad Plumer, Vox, 28/11/2014.
[vii] Source: FactSet, as of 13/5/2021. Statement based on Brent Crude Oil Global Spot Price and MSCI World Energy return with net dividends, GBP, 19/6/2014 –31/12/2014.
[viii] “The United States Is Now the Largest Global Crude Oil Producer,” US Energy Information Administration, 12/9/2018. Date accessed: 12/5/2021.
[ix] “How Accurate Are Peak Oil Demand Projections?” Felicity Bradstock, OilPrice.com, 22/4/2021.
[x] “Oil 2021,” IEA, March 2021.
[xi] “Short-Term Energy Outlook,” EIA, 6/5/2021.
[xii] Ibid.
[xiii] “OPEC and Allies Agree to Gradually Increase Production After Days of Discussions,” Sam Meredith, CNBC, 3/12/2020.
[xiv] “OPEC+ Reaches Deal to Cut Oil Production by 9.7 Million Barrels Per Day,” Clare Duffy and Jill Disis, CNN, 13/4/2020.
[xv] “OPEC+ to Gradually Boost Oil Production Ahead of Expected Summer Rebound in Demand,” Camila Domonoske, NPR, 1/4/2021.
[xvi] U.S. Rig Count Increases As Oil Prices Hold Above $60,” Julianne Geiger, OilPrice.com, 16/4/2021.
Get a weekly roundup of our market insights.
Sign up for our weekly e-mail newsletter.

You Imagine Your Future. We Help You Get There.
Are you ready to start your journey to a better financial future?

Markets Are Always Changing—What Can You Do About It?
Get tips for enhancing your strategy, advice for buying and selling and see where we think the market is headed next.
Related Resources
-
Market Analysis A Market Perspective on Iran Truce Talks2026-06-17
-
Market Analysis Gold Fails the Safe Haven Test Again2026-06-17
-
Macro Insights Japanese Equity Outperformance & Why It's Poised to Continue2026-06-15
-
Macro Insights Assessing Private Credit Risks and Exposures2026-06-09


Contact Us
Learn why 200,000 clients trust Fisher Investments and its affiliates to manage their money and find out how we may be able to help you achieve your financial goals.
As of 31/03/2026. Includes Fisher Investments and its affiliates.
New to Fisher? Call Us.
Contact Us Today