Personal Wealth Management / Economics
Data Deep Dive: Q4 2021 US GDP
Based on the official data, even excluding inventories, GDP growth accelerated.
Q4 US gross domestic product (GDP, a government-produced measure of economic output) jumped 6.9% annualised (the rate at which GDP would grow over a full year if the quarterly growth rate repeated in all four quarters), beating expectations, but the report didn’t spark much cheer amongst commentators we follow upon its release last Thursday.[i] Many of them explained that much of the growth stemmed from a big bump in inventories—and they warned it won’t last, meaning headline growth will likely weaken soon. Whilst that may be, we don’t think it would be a sign of economic weakness or a problem for stock markets. Looking under the surface at GDP’s pure private sector demand components, growth looked fine to us.
Exhibit 1 breaks out headline GDP growth (blue line) into two categories: the one commentators questioned last week, inventories (red column), and what we consider pure private sector domestic demand (pink column)—broadly, consumer spending and business investment outside inventories. (Note: We exclude government and trade here, which were negligible in Q4.[ii])
Exhibit 1: Steady Underlying Core Demand Growth Post-Reopening
Source: FactSet, as of 27/1/2022. US real GDP and components, Q1 2019 – Q4 2021. Pure private domestic demand aggregates consumer spending and fixed investment (excluding inventories) categories.
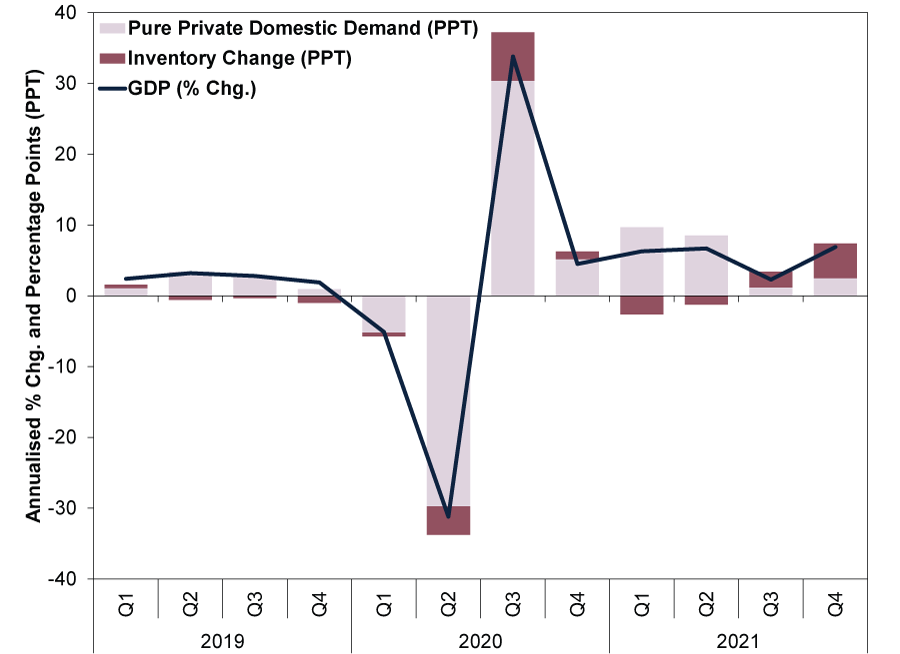
In Q4, you can see inventories’ big contribution. But if you just look at the first bucket, spending and investment, we think you get a better sense of the underlying economic trend that our research shows matters more for markets. In our view, it slowed sharply in Q3 mostly because heady, earlier consumer spending catch-up growth rates—11.4% annualised in Q1 and 12.0% in Q2—from mass vaccinations and thawing social-distancing restrictions largely exhausted pent-up demand.[iii]
But we don’t think that means demand is now absent—just that it isn’t inflated by prior lockdowns anymore. For instance, services spending—the majority of household expenditures—rose 4.7% annualised in Q4.[iv] Services growth was also broad-based, with all major categories (housing, health care, transportation, recreation, food and financial services) contributing to growth.[v] The bedrock of GDP growth remains solid, in our view.
On the investment side, growth resumed after a slight dip in Q3.[vi] Whilst business investment can be volatile, particularly for durable goods (think heavy equipment and machinery), quarter-to-quarter fluctuations are normal during overall economic expansion, based on our historical analysis. More interesting to us: Tech’s growing influence, particularly intellectual property products (think software, research & development and patents). This category has grown rapidly—and steadily—to become almost a third of all business investment, and we don’t think it looks likely to slow down any time soon.[vii]
Now, inventories’ 4.9 percentage point contribution to GDP growth last quarter seems pretty straightforward to us: American businesses, faced with supply chain chaos and the risk of not having enough inventory to meet demand at the holidays and beyond, raced to build stockpiles.[viii] As the historically low levels of the US Census Bureau’s total inventories-to-sales ratio shows, businesses came into the holiday season with shelves relatively thin.[ix] In our view, there is a possibility they overshot accidentally, or perhaps it was a deliberate pre-emptive move against anticipated supply chain kinks early this year. Either way, we think it seems fair to expect something of an inventory drawdown in the next couple of quarters. A plausible scenario: As companies work through stockpiles, GDP growth might slow—hence, the present concern amongst commentators we follow.
But we don’t think this amounts to some massive inventory excess that a recession (a broad decline in economic activity, often defined as two consecutive quarters of falling GDP) needs to correct. A single quarter’s build, which was likely concentrated in December, doesn’t constitute a troubling trend, in our view—just a typical adjustment expanding economies often feature, making them more durable longer term. For example, during America’s long 2009 – 2020’s economic expansion, inventories detracted from GDP growth for six straight quarters from Q2 2015 to Q3 2016.[x] Recession didn’t ensue.[xi] Note, too, that whilst sharp inventory drawdowns often accompany a recession as businesses get lean and mean, according to our research, they alone are likely just part of the accumulated excess. We think that excess is also typically apparent in broader malinvestment in the preceding quarters, which we aren’t seeing right now. Rather, businesses appear to be expanding production to meet acute supply shortfalls. This could snowball into misdirected investment later, but for now, we don’t see cause for alarm.
Whilst we think watching for signs of excess that will eventually need to be corrected is wise, for now, it doesn’t seem likely. But we do think the fast catch-up phase is largely behind the US economy, with growth likely to slow—which our research shows is fine for stocks. To us, growth always looked set to slow following reopening—economic activity doing just that shouldn’t surprise. But this wasn’t always the consensus opinion of financial commentators we follow. A year ago, they were talking up a new Roaring Twenties—uninterrupted fast economic growth for another decade—as vaccines rolled out, anticipating a robust expansionary period like the one that followed the 1918 influenza pandemic.
At the time, we cautioned investors to temper their expectations. We thought the Roaring Twenties analogy seemed like a case of correlation without causation, made more convenient by the coincidence of COVID striking in 2020. A return to more pedestrian pre-pandemic growth trends looked more likely to us after the reopening bounce faded. Now, commentators we follow appear to be overcorrecting, saying the economy will hit the rocks as supposed stimulus from monetary and fiscal policy runs out. We think such prognostications will probably also prove wrong.
America’s pure private sector domestic activity’s acceleration gives you a sense of this, in our view. Q4’s 2.5% annualised growth is about what the pre-pandemic expansion rate was.[xii] That may seem unexceptional, but our research shows it was also fine for stocks throughout the 2009 – 2020 bull market (extended period of broad stock gains), and we don’t see any indication that is likely to change. We also don’t see much (if any) evidence the economy relies on support from the Federal Reserve and Treasury. Rather, we think with leading credit indicators still positive, household finances on fine footing and businesses just starting to pick up where they left off pre-pandemic, growth looks likely to continue.[xiii]
Outside of supply disruptions and restocking skew, the economy is looking pretty normal, in our view.
[i] Source: Bureau of Economic Analysis, as of 27/1/2022. Real US GDP, Q4 2021.
[ii] Ibid. Statement based on government spending and net exports contribution to Q4 real US GDP.
[iii] Ibid. US personal consumption expenditures (PCE), Q1 2021 – Q2 2021.
[iv] Ibid. US PCE services, Q4 2021.
[v] Ibid. Statement based on US PCE services categories’ Q4 growth.
[vi] Ibid. Statement based on US business investments’ Q4 growth.
[vii] Ibid. Statement based on intellectual property products’ share of Q4 US business investment.
[viii] Ibid. Inventory change contribution to US real GDP growth, Q4 2021.
[ix] Source: Federal Reserve Bank of St. Louis, as of 28/1/2022. Total US business inventory-to-sales ratio was 1.25 in November, the latest data available.
[x] Ibid. Statement based on inventory change’s contribution to Q2 2015 – Q3 2016 US real GDP growth.
[xi] Ibid. Statement based on Q2 2015 – Q3 2016 US real GDP growth.
[xii] Source: Bureau of Economic Analysis, as of 27/1/2022. US PCE and fixed business investment, Q4 2021.
[xiii] Source: The Conference Board and Federal Reserve, as of 1/2/2022. Statement based on the US Leading Credit Index, December 2021, and US household financial obligations as a percentage of disposable personal income, Q3 2021.
Get a weekly roundup of our market insights.
Sign up for our weekly e-mail newsletter.

You Imagine Your Future. We Help You Get There.
Are you ready to start your journey to a better financial future?

Markets Are Always Changing—What Can You Do About It?
Get tips for enhancing your strategy, advice for buying and selling and see where we think the market is headed next.
Related Resources
-
Politics Beyond the War: A Political Roundup Covering America, Canada and Denmark2026-03-18
-
Economics Doubts Aplenty After UK January GDP Flatlined2026-03-18
-
Environmental, Social and Governance Insights Responsible Investment Newsletter 20262026-03-11
-
Economics Pain at the Petrol Station Won’t Hurt the Global Economy2026-03-11


Contact Us
Learn why 195,000 clients trust Fisher Investments and its affiliates to manage their money and find out how we may be able to help you achieve your financial goals.
As of 31/12/2025. Includes Fisher Investments and its affiliates.
New to Fisher? Call Us.
Contact Us Today