Personal Wealth Management / Market Analysis
Finding Flowers in Springtime Economic Data
Despite myriad economic concerns, the data aren’t as poor as many experts seem to think.
Elevated inflation has dominated financial headlines we monitor over the past 12 months, and we have seen arguments that high prices along with the Russia-Ukraine war have delivered a big setback to the global economy. Last week the International Monetary Fund reduced its 2022 and 2023 global growth projections, following the World Bank and other private forecasters.[i] But some recent economic data from developed nations leads us to conclude reality likely isn’t as poor as many commentators we follow warn.
The Latest PMIs Still Say Growth
S&P Global’s April flash (preliminary) purchasing managers’ indexes (PMIs) implied ongoing economic growth in major developed nations. (Exhibit 1) PMIs are surveys measuring whether companies’ purchasing managers saw improvement or deterioration across a number of categories. Readings above 50 suggest expansion, although they measure only the rough percentage of businesses enjoying higher activity, not how much their businesses grew (or shrank) in aggregate.
Exhibit 1: The Latest PMIs
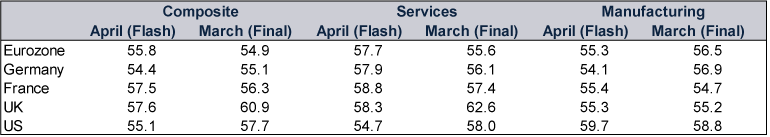
Source: FactSet and S&P Global, as of 25/4/2022.
We found April’s expansionary eurozone readings interesting since we have seen several economists argue Germany may be in recession (a broad decline in economic activity), which is often defined as two consecutive quarters of falling gross domestic product (GDP, a government-produced measure of economic output). This morning, Germany’s Federal Statistics Office announced GDP grew 0.2% q/q in Q1, breaking Q4 2021’s small contraction—a noteworthy development, considering Q1 spans both the Omicron wave and the beginning of the war in Ukraine.[ii] The PMIs hint further at Germany’s economic resilience, and we think they also suggest that resilience has continued in Q2 thus far. In our view, the same goes for the broader eurozone, where economic reopenings have boosted the services sector, and a return to pre-pandemic trends implies services-led growth—a positive for the services-heavy eurozone economy.[iii]
Though the Continent theoretically is most vulnerable economically to Russia-Ukraine war fallout due to its geographical proximity and economic ties, we think PMIs are compelling evidence of the eurozone’s resilience. If Europe doesn’t enter a recession due to the conflict and dislocations from sanctions, we think it is unlikely a global one manifests, either.
The Message From UK and Canadian Retail Sales
After US March retail sales hinted at consumer demand holding up despite high prices, the UK and Canada offered additional colour. March UK retail sales fell on both a value and volume basis (-0.2% m/m and -1.4% m/m, respectively).[iv] Volume estimates remove price change impacts, giving a better idea of how much stuff businesses sold. Though elevated prices likely influenced UK consumers’ spending, a look at the underlying components reveals some interesting nuance, in our view.
Non-store retail sales volumes (-7.9% m/m) detracted most, falling again after February’s -6.9%.[v] The Office for National Statistics highlighted affordability concerns, as the statistics agency’s March survey found 54% of adults reported spending less on non-essentials.[vi] But February and March’s declines also follow strong December and January non-store sales, when Omicron concerns likely boosted online buying as shoppers stayed home.[vii] Petrol and food store sales volumes also unsurprisingly detracted from the headline number.[viii] For the former, high prices appear to be regulating demand for petrol, which is how we think markets work generally. For the latter, food store sales volumes have been slipping since November 2021, partially due to higher spending in pubs and restaurants as COVID restrictions relaxed.[ix]
We think Canadian retail sales paint a similarly mixed picture. We have seen market analysts forecast high prices crimping Canadian consumer spending, as Canada’s Consumer Price Index (a broad measure of goods and services prices) rose 6.7% y/y in March, a 31-year high and well above analyst expectations of 6.1%.[x] An advance estimate showed March retail sales rose 1.4% m/m in value terms, but without volumes (which aren’t available yet), inflation’s impact isn’t clear.[xi]
However, February retail sales (0.1% m/m in value terms, -0.4% m/m in volume terms) suggest Canadian retail trends are in line with other developed nations.[xii] Auto industry categories detracted due in part to shortages rather than non-existent demand—mirroring a trend we have seen in other developed nations, including the US.[xiii] Positively, clothing stores’ sales volumes jumped.[xiv] Based on our research on economic reopenings, some provinces’ relaxing of COVID restrictions in February likely prompted some consumers to spruce up their wardrobes.
Whilst we think it is fair to posit higher prices are influencing the categories in which consumers are spending, we don’t think it is accurate to pin March’s lacklustre retail sales numbers on elevated inflation alone—in our view, other forces are likely at work, including the shift to a post-COVID reality. Moreover, we think retail sales shed limited insight since they don’t reflect most services spending, which tends to be less sensitive to the economy’s ups and downs and comprises a larger portion of total consumer spending in developed nations, according to our research. This point was made more clear in the US by the 0.2% rise in the country’s inflation-adjusted personal consumption expenditures, a broader dataset including services spending.[xv]
US LEI’s Positive Message
One reason to be optimistic about growth in the world’s largest economy: a high and rising Leading Economic Index (LEI), which is a composite of 10 mostly forward-looking economic indicators. According to research outfit The Conference Board, which compiles and publishes this statistic, US LEI rose 0.3% m/m in March, its 11th rise in the past 12 months.[xvi] Of the 10 underlying components, 7 contributed positively.[xvii] The yield spread added 0.24 percentage point whilst average weekly jobless claims added 0.18 point.[xviii] Though we don’t think the latter is useful on a forward-looking basis—jobs data are lagging economic indicators, which yield little information on where stocks are headed next, in our view—we think the former bodes well. The difference (or spread) between the US 10-year Treasury yield and federal funds rate (which is the Federal Reserve’s benchmark interest rate) gives a sense of banks’ profit margin on new loans. Banks are in the business of borrowing at short-term rates and lending at long-term rates. The wider the spread between those rates, the more incentive banks have to lend, which our research shows gets money moving through the economy, spurring economic growth. Positively, that spread widened over the past three months, from 1.68 percentage points in January to 1.93 points in March.[xix] Yet based on our review of financial headlines, few analysts have noticed this positive economic development—queuing up upside surprise potential, in our view.
According to our research, no traditional modern American recession began whilst LEI was high and rising. LEI has declined for several months before every US recession since World War II, with 2020’s lockdown-driven downturn—an unusual recession with no precedent—the lone exception.[xx] We have seen many experts argue a US recession looms, but in our view, LEI’s growthy signals today suggest those warnings may be off base.
[i] “War Dims Global Economic Outlook as Inflation Accelerates,” Pierre-Olivier Gourinchas, IMF, 19/4/2022.
[ii] Source: FactSet, as of 29/4/2022.
[iii] Ibid. S&P Global eurozone services PMI, April 2022 (flash).
[iv] Source: Office for National Statistics, as of 25/4/2022. “Retail Sales, Great Britain: March 2022.”
[v] Ibid.
[vi] Ibid.
[vii] Ibid.
[viii] Ibid.
[ix] Ibid.
[x] “Canada Inflation Surges More Than Expected in March, Hitting 31-year High,” Julia Gordon, Reuters, 20/4/2022.
[xi] Source: Statistics Canada, as of 25/4/2022.
[xii] Ibid.
[xiii] Ibid.
[xiv] Ibid.
[xv] Source: US Bureau of Economic Analysis, as of 29/4/2022.
[xvi] Source: FactSet, as of 25/4/2022.
[xvii] Ibid.
[xviii] Ibid.
[xix] Ibid.
[xx] Ibid. Statement based on US LEI, January 1959 – March 2022.
Get a weekly roundup of our market insights.
Sign up for our weekly e-mail newsletter.

You Imagine Your Future. We Help You Get There.
Are you ready to start your journey to a better financial future?

Markets Are Always Changing—What Can You Do About It?
Get tips for enhancing your strategy, advice for buying and selling and see where we think the market is headed next.
Related Resources
-
Market Analysis Why El Niño Doesn’t Necessitate Portfolio Shifts2026-07-02
-
Market Analysis Today in Brexit, Day 3,652: Brexit Turns 102026-06-24
-
Market Analysis Reviewing America’s Q1 Earnings and What Q2 Expectations Say2026-06-23
-
Politics Revolving Door Turns, Uncertainty Starts Falling2026-06-23


Contact Us
Learn why 200,000 clients trust Fisher Investments and its affiliates to manage their money and find out how we may be able to help you achieve your financial goals.
As of 31/03/2026. Includes Fisher Investments and its affiliates.
New to Fisher? Call Us.
Contact Us Today