Personal Wealth Management / Economics
January Pointed Positively for the US Economy
Rounding up the latest—and largely overshadowed—positive US economic data.
In some non-Russia-Ukraine news, January numbers came out for several widely watched US economic datasets last Friday. Whilst many market observers we follow forecast weaker results due to headwinds ranging from rising prices to Omicron, the official numbers largely exceeded expectations. In our view, January’s growthy figures suggest the US economy is on solid footing and remains more resilient than many economists we have seen argue—useful perspective given all of today’s alleged economic headwinds.
The latest personal consumption expenditures (PCE) price data featured in most financial publications we monitor, as the US Bureau of Economic Analysis’s (BEA’s) headline price index is the US Federal Reserve’s preferred gauge for tracking price trends. Due to that, we have seen financial commentators argue PCE price data will sway Federal Reserve officials’ decision-making. The PCE price index rose 6.1% y/y in January, its fastest rate since 1982.[i] The core PCE price index (which excludes volatile food and energy prices) accomplished a similar feat, rising 5.2% y/y—its quickest pace since 1983.[ii] On a monthly basis, the PCE price index climbed 0.6%, in line with its growth rate over the past three months.[iii] Now, we don’t think the BEA’s price data reveal much new since other widely watched US price gauges, including the Bureau of Labor Statistics’ Consumer Price Index (CPI) and Producer Price Index (PPI), have shown similar trends recently.[iv]
However, the BEA did find January consumer spending held up despite rising prices. January retail sales, released by the US Census Bureau, which rose 3.8% m/m, first hinted that today’s elevated inflation (economy-wide rising prices) wasn’t denting spending, though the gauge has limits.[v] The Census Bureau doesn’t apply inflation adjustments to retail sales, and retail trade doesn’t include most services spending, which comprises nearly two-thirds of total household expenditures.[vi] We think PCE data help address those questions. January’s real (i.e., inflation-adjusted) PCE rose 1.5% m/m, with goods spending (4.3%) stronger than services (0.1%).[vii] We don’t think the split between the two types of spending is a big surprise, given the Omicron variant kept workers and consumers home. Our research shows COVID-related fallout weighed on people-facing services industries in particular, including restaurants and bars (-1.3% m/m), hotels and motels (-3.5%) and air travel (-0.9%).[viii] Whilst one month’s data, positive or negative, doesn’t make a trend, we think growth in the face of higher prices reveals strong consumer demand—and counters arguments elevated prices are an automatic negative for a large swath of US economic activity.
January’s US personal savings rate drop from December’s 8.2% to 6.4%—the lowest since 2013—also drove commentary amongst financial publications we cover.[ix] Some experts we follow argued the COVID-driven savings boom may be ending—which could have implications for consumer spending.[x] However, our research suggests doesn’t support the feared fallout. The BEA defines the personal savings rate as the percentage of people’s disposable income they save after taxes and personal spending. We think this definition has limits. For example, the BEA doesn’t count realised capital gains (which result from selling an investment at a higher price than what the owner paid for it) as income even though capital gains taxes subtract. In our experience, since many people—particularly retirees—use invested savings and realise investment gains to meet cash flow needs, America’s official savings rate likely understates actual savings. Moreover, the dip in January’s number was likely tied partially to a one-time factor: the expiration of temporary monthly Child Tax Credit payments, which were a part of the American Rescue Plan—the $1.9 trillion (£1.4 trillion) pandemic relief package signed by President Joe Biden in March 2021.[xi]
The savings rate also doesn’t predict consumer spending, as some recent history illustrates. From January 2015 – January 2020, the US monthly personal savings rate averaged 7.4% whilst consumer spending climbed.[xii] (Exhibit 1) In early 2020, the savings rate spiked and consumer spending plummeted—both due to America’s first COVID lockdown. Whilst COVID-related skew left the past 25 months looking wonky, both measures appear to be returning to their pre-pandemic trends.[xiii] Savings and consumer spending may move in opposite directions at times—particularly during recessions (broad decline in economic activity) and stretches of economic stress—but our research shows the savings rate doesn’t foretell consumption.[xiv]
Exhibit 1: The Personal Savings Rate and Consumer Spending, January 2015 – January 2022
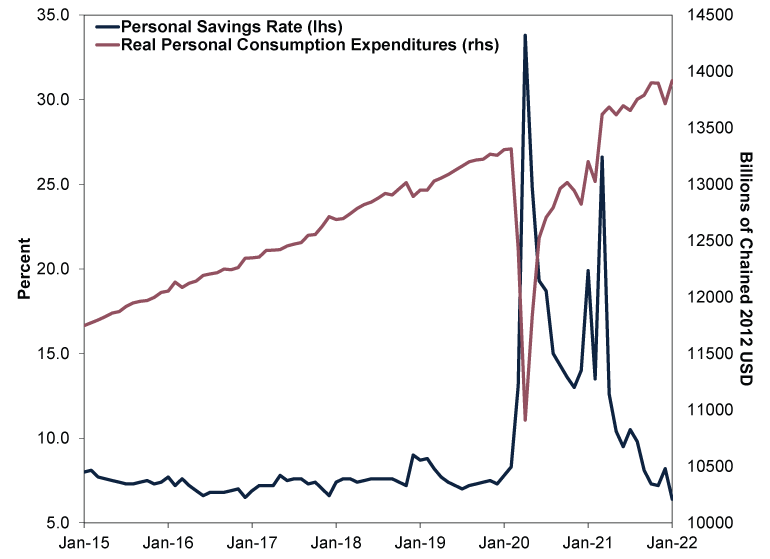
Source: St. Louis Federal Reserve, as of 28/2/2022. US personal savings rate and real personal consumption expenditures in billions of chained 2012 US dollars at seasonally adjusted annual rates, January 2015 – January 2022.
Rounding out the latest US economic data, January durable goods orders rose 1.6% m/m, well ahead of expectations of 0.7%.[xv] Widely watched nondefense capital goods orders, excluding aircraft, (also referred to as core capital goods orders) rose 1.0% m/m, continuing a positive streak starting in March 2021.[xvi] Based on our coverage of financial publications, many economists treat core capital goods orders (think computer equipment or industrial machinery) as a proxy for business investment, which our research finds is often the swing factor for gross domestic product (GDP, a government-produced measure of economic output). Yet capital goods are just one part of business investment, which also includes software, research & development, and structure spending. Though core capital goods orders can shed some insight on a segment of business spending, our research suggests it isn’t necessarily a leading indicator for the broader economy. Now, we think focusing on orders alone risks overlooking production issues, especially since many companies still face supply-related headwinds, from shortages to bottlenecks. But new orders’ growth over the past 10 months indicates capital spending’s resiliency—a sign of strong domestic demand, in our view. Plus, data released Thursday showed factory shipments accelerated in January.[xvii]
As with most widely watched economic measures, these data confirm what recently happened—old news to forward-looking stocks, in our view. But given the many discussions about headwinds from inflation to geopolitical conflict—and the challenges they pose to economic output—we think solid growth out of the world’s largest economy offers a reminder that the global bull market (a period of rising equities) stands on firm fundamental footing.[xviii]
[i] Source: Bureau of Economic Analysis and St. Louis Federal Reserve, as of 28/3/2022. “Personal Income and Outlays, January 2022” and US PCE price index, year-over-year change, February 1982.
[ii] Ibid. US PCE excluding food and energy price index, April 1983.
[iii] Ibid.
[iv] Source: St. Louis Federal Reserve, as of 15/2/2022. US Consumer Price Index (All Items, US City Average) and US Producer Price Index: Final Demand, year-over-year percent change, January 2021 – January 2022.
[v] Source: FactSet, as of 3/3/2022.
[vi] Source: BEA, as of 1/3/2022. Statement based on services spending as percentage of US personal consumption expenditures in 2021.
[vii] See note i.
[viii] Ibid.
[ix] Ibid.
[x] “Pandemic Savings Boom May Be Ending, and Many Feel Short of Cash,” Ben Casselman, The New York Times, 25/2/2022. Accessed via The Internet Archive.
[xi] “Robust Consumer Spending, Core Capital Goods Orders Highlight U.S. Economic Strength,” Lucia Mutikani, Reuters, 25/2/2022.
[xii] Source: St. Louis Federal Reserve, as of 28/2/2022. US Personal Savings Rate, January 2015 – January 2020.
[xiii] Source: St. Louis Federal Reserve, as of 28/2/2022. US personal savings rate and US real personal consumption expenditures in billions of chained 2012 US dollars at seasonally adjusted annual rates, January 2015 – January 2022.
[xiv] Ibid. Statement based on US personal savings rate and US real personal consumption expenditures in billions of chained 2012 dollars at seasonally adjusted annual rates, January 2002 – January 2022.
[xv] Source: FactSet, as of 28/2/2022.
[xvi] Source: FactSet, as of 4/3/2022. Nondefense capital goods orders, excluding aircraft, month-over-month change, March 2021 – January 2022.
[xvii] Source: FactSet, as of 3/3/2022.
[xviii] Source: World Bank, as of 3/3/2022. US real GDP in 2020.
Get a weekly roundup of our market insights.
Sign up for our weekly e-mail newsletter.

You Imagine Your Future. We Help You Get There.
Are you ready to start your journey to a better financial future?

Markets Are Always Changing—What Can You Do About It?
Get tips for enhancing your strategy, advice for buying and selling and see where we think the market is headed next.
Related Resources
-
Politics Beyond the War: A Political Roundup Covering America, Canada and Denmark2026-03-18
-
Economics Doubts Aplenty After UK January GDP Flatlined2026-03-18
-
Environmental, Social and Governance Insights Responsible Investment Newsletter 20262026-03-11
-
Economics Pain at the Petrol Station Won’t Hurt the Global Economy2026-03-11


Contact Us
Learn why 195,000 clients trust Fisher Investments and its affiliates to manage their money and find out how we may be able to help you achieve your financial goals.
As of 31/12/2025. Includes Fisher Investments and its affiliates.
New to Fisher? Call Us.
Contact Us Today