Personal Wealth Management / Market Analysis
Look Beyond 2022’s Rocky Start
In our view, stocks look likely to deliver more positive returns this year.
Editors’ Note: Our commentary is politically agnostic, as we prefer no party nor any politician. We assess political trends for their potential economic and market impact only.
One week in, and 2022 might feel a lot different from 2021. After finishing rising nicely in December’s last 10 days, stocks have stumbled in the young New Year.[i] Where markets appeared to enter 2021 in a blaze of optimism, sentiment now seems more muted, with potentially fear-inducing headlines dotting many financial publications we follow. Our advice: Take a deep breath. For whilst we think this bull market (long period of generally rising stock markets) is very likely to continue and deliver solid full-year returns for broad developed-world stock markets, we also think the bulk of those returns are likely to come later in the year, with much more of a grind early on. For long-term growth investors needing market-like returns to meet their goals, we suspect patience is the watchword.
Note: This doesn’t mean the early part of the year is destined to be bad, or that the recent sentiment-driven swings are indicative of how it will play out. As we will show you shortly, America’s “midterm” congressional election years (widely named as such because they occur in the middle of a president’s term) are routinely back-end-loaded, with the S&P 500 index in US dollars averaging small positive returns early, with more variability, before a second-half surge.[ii] In our view, this is likely a key driver of global returns, as America represents nearly 70% of developed-world stock markets and US markets typically have a strong correlation with developed-world markets outside the US—meaning they move together much more often than not.[iii]
As Exhibit 1 shows, the midterm year, which is the second year of a president’s term has the lowest average S&P 500 return of all four years in the presidential cycle—not because it is regularly weak, but because returns are more variable. The S&P 500 is usually up big or down, without much between. In our view, the positive years usually happen when midterms increase political gridlock, which our research shows reduces political uncertainty and generally benefits stock markets. We think increased gridlock is what typically brings big tailwinds late in the year—which often carry on into year three, historically the best of the cycle.
Exhibit 1: The Presidential Term Anomaly
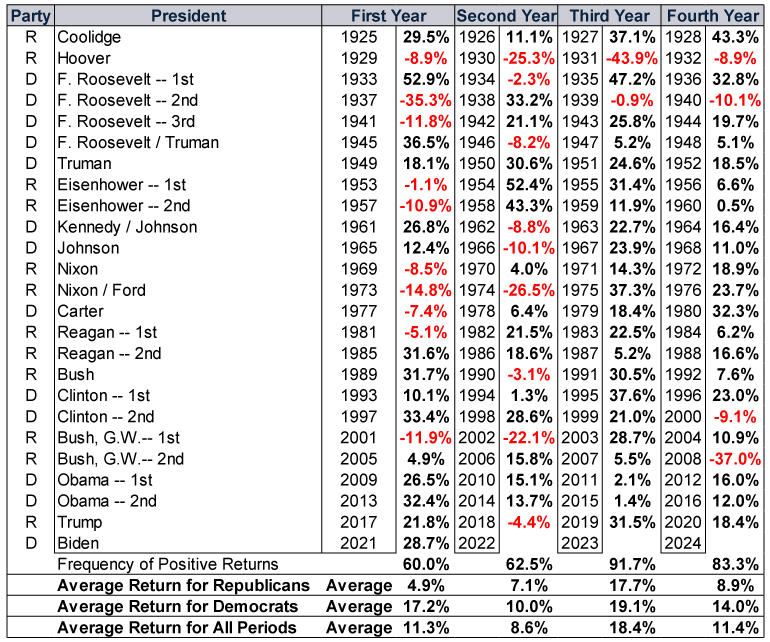
Source: Global Financial Data, Inc. and FactSet, as of 4/1/2022. S&P 500 total returns by calendar year, 1925 – 2021. Presented in US dollars. Currency fluctuations between the dollar and pound may result in higher or lower investment returns.
But the path to that late-year boom typically isn’t smooth. As Exhibit 2 shows, returns are usually a grind for the first three quarters of the midterm year, which are positive only 57% of the time.[iv] That is better than 50/50—and not a reason to avoid stocks, in our view, but it is also below stocks’ average frequency of positivity in calendar quarters.[v] It isn’t until stocks start pricing in the high likelihood of increased gridlock later in the year that the party really starts, according to our research. Note, we do not think this is a market-timing tool (nor do we think such tools even exist). We could get stellar midterm returns earlier than this. But we think the pattern is instructive and can help you frame expectations.
Exhibit 2: Midterm Years Are Usually Back-End Loaded

Source: Global Financial Data, Inc., as of 10/8/2021. Average S&P 500 Index price returns in second and third years of the presidential cycle, 1925 – 2019. Presented in US dollars. Currency fluctuations between the dollar and pound may result in higher or lower investment returns. Please see the chart at the end of this article for a full depiction of the S&P 500’s history.
We think the midterm campaigns have a lot to do with this grind, as politicians’ shouting about contentious issues tends to raise uncertainty. In our view, all the noise can make it hard for people to see the simple history that midterms usually favour the party in opposition to the president.[vi] That isn’t an ideological statement, mind you—we thought 2018’s midterms favoured Democrats, and now we think sitting in opposition gives Republicans the edge. That edge likely gets a boost this year from a factor we think will probably contribute to weaker sentiment early on: the once-a-decade redrawing of constituency boundaries, known officially as “redistricting.” Thus far, the new electoral maps—which are based on 2020’s US census and created by either state legislatures or independent commissions, depending on each state’s rules—appear to have created a few more Republican seats, but notably, they have also added safe seats on both sides whilst reducing the number of swing districts.[vii]
In our view, this is likely to affect the midterm campaign’s tenor. Typically, in swing districts, incumbents’ main task is seeing off a challenge from the other party. We think this gives them an incentive to tack toward the centre and moderate their tone and rhetoric—an incentive we think holds for both parties. But in safe seats, an incumbent’s biggest threat isn’t the other party, but a challenge from a rival within their own party. Based on our observations of America’s political landscape, many centrist Democrats face potential challenges from the party’s progressive wing (or vice-versa), whilst several centrist Republicans are trying to fend off challenges from their party’s populist flank (or vice-versa). These people therefore have an incentive to be loud and extreme. More safe seats in 2022 therefore probably brings a louder, more shrill campaign, with both parties spouting extreme rhetoric whilst the handful of candidates in swing districts beg everyone to pipe down. We think the added shouting is likely to weigh on sentiment more than a typical midterm campaign, contributing to the early-year grind we think is likely. But it also probably sets sentiment very low, which could tee up even bigger late-year returns than usual as increased gridlock becomes ever-more apparent.
International political drivers appear likely to chart a similar course. France and Australia hold national elections this spring, likely adding to the early-year uncertainty. In the UK, Prime Minister Boris Johnson’s political capital appears to be draining rapidly in the face of scandals and rising living costs. This has prompted a mounting rebellion within his Conservative Party, which may lead to a leadership challenge—especially if the Labour Party continues gaining in the polls.[viii] This situation will eventually resolve one way or another, likely leading to falling uncertainty and more gridlock—just as the Australian and French results will bring clarity. But early on there will likely be plenty of noise, which could make investor sentiment retreat.
Politics isn’t the only factor we think is likely to hold sentiment down. Markets’ reaction to the prospect of an early-year US Federal Reserve interest rate hike is probably a foretaste of the grind likely to ensue as inflation, Omicron (and perhaps more variants), geopolitical tensions and more filter through headlines. Warnings of their negative effect on markets, which we are already seeing in headlines, might even look right for a while, if these scare stories (as we call them) prompt a pullback or correction (a short, sharp, sentiment-fuelled drop of -10% to -20%). Our research shows corrections can happen at any time, for any or no reason, scare story or no.
But it won’t last forever. In our view, reality is likely to demonstrate that monetary policymakers’ interest rate rises lack much power over the economy. The year-ago calculation base that drove up the year-over-year inflation rate in 2021 will likely start dampening it around mid-year, once it includes last year’s higher prices. (In other words, the denominator in the year-over-year inflation rate calculation will rise.) We think supply chain issues are likely to even out as the world gets increasingly better at living with endemic COVID—which we are already starting to see, as the US and UK resisted Omicron lockdowns. The more people see life continuing alongside the virus—and if economic indicators hold up—the more the virus’s power over sentiment appears likely to wane. We think all of this clearing fog is likely to contribute to falling uncertainty later this year—aiding returns.
So stand firm. If you need long-term growth to reach your personal goals, we think capturing bull market returns is vital. We often say stocks’ long-term returns are the reward for staying patient through volatility along the way, and we think 2022 will likely be a shining microcosm of this. And of course, your friendly MarketMinder Europe editors will be here to help guide you through.
May you all have a healthy and happy 2022.
Addendum: S&P 500 Price Index, 1925 – 2021
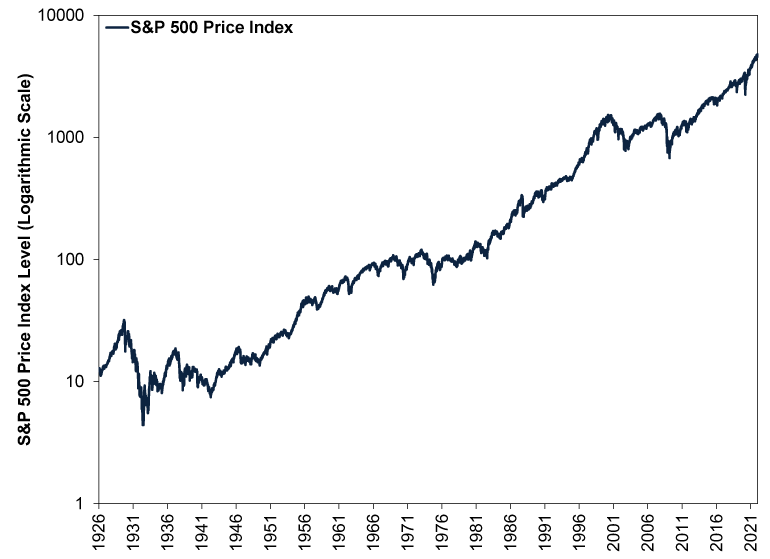
Source: Global Financial Data, Inc., as of 7/1/2022. S&P 500 price index level, 12/31/1925 – 12/31/2021. Presented in US dollars. Currency fluctuations between the dollar and pound may result in higher or lower investment returns. Y-axis uses a logarithmic scale, which is a non-linear scale often used to display long-term exponential returns to improve visibility in a multi-decade data set.
[i] Source: FactSet, as of 7/1/2022. Statement based on MSCI World Index returns with net dividends.
[ii] Source: Global Financial Data, Inc., as of 7/1/2022. Statement based on S&P 500 price returns in US midterm election years, 1925 – 2021. Presented in US dollars. Currency fluctuations between the dollar and pound may result in higher or lower investment returns.
[iii] See Note i. Statement based on MSCI World Index and constituent countries’ market capitalisation on 31/12/2021. Market capitalisation is a measure of a company or index’s total market value, calculated by multiplying share price by the number of shares outstanding. Statement also based on the correlation coefficient between the S&P 500 in US dollars and the MSCI World Ex. USA Index in local currencies. The correlation coefficient is a statistical measure of the directional relationship between two variables. A correlation of 1.0 implies lockstep movement, 0 implies no relationship, and -1.0 implies they move in opposite directions. Currency fluctuations between the pound and other currencies may result in higher or lower investment returns.
[iv] Source: Global Financial Data, Inc., as of 6/1/2022. Statement based on S&P 500 total returns in Q1, Q2 and Q3 of US midterm election years, 1925 – 2021. Presented in US dollars. Currency fluctuations between the dollar and pound may result in higher or lower investment returns.
[v] Ibid. Statement based on S&P 500 total returns in calendar quarters, 1925 – 2021. Presented in US dollars. Currency fluctuations between the dollar and pound may result in higher or lower investment returns.
[vi] Source: US House of Representatives and US Senate, as of 7/1/2022.
[vii] Source: FiveThirtyEight and Politico, as of 7/1/2022.
[viii] Source: Politico, as of 7/1/2022.
Get a weekly roundup of our market insights.
Sign up for our weekly e-mail newsletter.

You Imagine Your Future. We Help You Get There.
Are you ready to start your journey to a better financial future?

Markets Are Always Changing—What Can You Do About It?
Get tips for enhancing your strategy, advice for buying and selling and see where we think the market is headed next.
Related Resources
-
Market Analysis Today in Brexit, Day 3,652: Brexit Turns 102026-06-24
-
Market Analysis Reviewing America’s Q1 Earnings and What Q2 Expectations Say2026-06-23
-
Politics Revolving Door Turns, Uncertainty Starts Falling2026-06-23
-
Macro Insights SpaceX IPO and Rising Equity Supply2026-06-23


Contact Us
Learn why 200,000 clients trust Fisher Investments and its affiliates to manage their money and find out how we may be able to help you achieve your financial goals.
As of 31/03/2026. Includes Fisher Investments and its affiliates.
New to Fisher? Call Us.
Contact Us Today