Personal Wealth Management / Market Analysis
Amidst Early-Year Interest Rate Rise Fretting, Stay Cool
As we will show, market data suggest the first rate hike in a tightening cycle isn’t inherently bearish.
The new year is off to something of a rocky start, particularly for Tech stocks, with many wagging an accusatory finger at the US Federal Reserve (Fed)—which sets monetary policy in the country that represents nearly 70% of the MSCI World Index’s market value, making its moves and words widely watched globally.[i] No sooner had the world finished digesting the monetary policy institution’s plans to double the pace of tapering its quantitative easing (QE) asset purchases, then minutes from the December meeting suggested monetary policymakers determined the economy has largely met their self-imposed criteria for hiking short-term interest rates. Moreover, they said “it may become warranted to increase the federal funds sooner or at a faster pace than participants had earlier anticipated.”[ii] Now many Fed watchers we follow say the first rate hike could come in March, when QE is scheduled to end, and they are pinning the blame for the S&P 500’s -1.9% drop Wednesday on this development.[iii] Perhaps—our research shows negativity can strike for any or no reason, and Fed pronouncements often get what we consider undue attention. But we suggest investors seeking long-term portfolio appreciation not dwell on short-term reactions. Over more meaningful stretches, historical market returns show the first in a series of rate hikes doesn’t automatically hurt stocks.
Our analysis focuses on the Fed and America’s S&P 500 returns in USD due to daily availability. However, this remains quite relevant to investors globally, in our view, due to both the high correlation between US and non-US stock and bond markets, as well as the US’s large position in global markets.[iv] Exhibit 1 shows the history of S&P 500 returns surrounding the first rate hike in all Fed rate hike or tightening cycles since 1971. As you will see, returns were positive in the first year after the rate hike 7 out of 10 times. Returns over the next two years were negative just once. Nothing here screams that rate hikes inherently cause bear markets (typically deep, lasting broad market declines of -20% or worse with fundamental causes).
Exhibit 1: S&P 500 Returns Surrounding Initial Rate Hikes
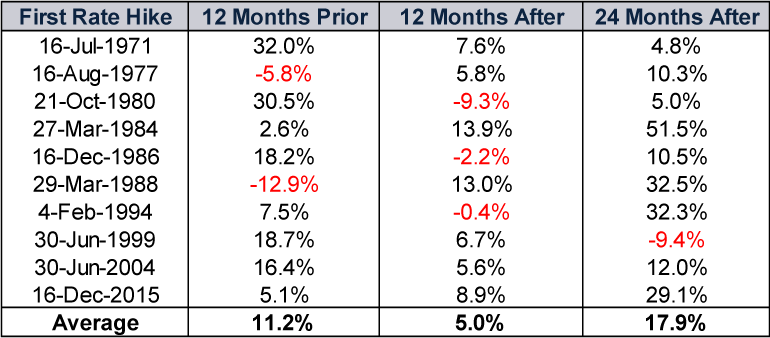
Source: FactSet, as of 5/1/2022. S&P 500 price returns, 16/7/1970 – 16/12/2017. Presented in US dollars. Currency fluctuations between the dollar and pound may result in higher or lower investment returns.
Now, the time from the first rate hike to the bull market’s eventual peak varies, ranging from a little over a month (1980) to more than six years (1994).[v] The 1986 and 1999 hikes happened less than a year before those bull markets ended, but in our opinion, it was a string of counterproductive moves—not the first rate hike itself—that eventually ended those bull markets (long periods of generally rising stock prices).[vi] In 1987, we think the Fed’s much more aggressive tightening later in the year, coupled with global currency management efforts, caused a liquidity shortage that contributed to the August – December bear market.[vii] In 1999, we think the Fed’s apparent decision to keep rates lower for longer ahead of the Millennium Bug forced them to play catch up in the New Year when the bug didn’t bite. Their rate hikes then brought short rates above long—inverting the yield curve, which is a graphical representation of on bond issuer’s interest rates across the spectrum of maturities.[viii] A large volume of economic theory and data show a lasting, material yield curve inversion can cause credit to tighten and eventually cause a recession, and in our view, this inversion in 2000 probably made the dot-com bubble crash a bit earlier than it otherwise would have, although we think that counterfactual is unknowable. Meanwhile, in 1980, we think it wasn’t just that the Fed under former Chair Paul Volcker’s leadership raised rates, but that the yield curve was already inverted when they hiked aggressively to battle double-digit inflation.[ix]
That isn’t the case today. There is a healthy 1.6 percentage-point gap between 3-month and 10-year US Treasury yields.[x] We think this is the most meaningful section of the yield curve as it best approximates banks’ business model—borrowing at short rates, lending at long rates and profiting off the spread. (The inversion generally signals negative profits on lending, which is why we think it causes credit to tighten.) Even though we think long-term rates are likely to stay range-bound this year—meaning, we don’t see them rising much (if at all)—the Fed still has plenty of latitude for one or more hikes (based on the Fed’s tendency to hike in quarter-point increments). We do think a Fed error is something to watch for, but acting in advance of that would be wrong, as our research shows an inverted curve alone isn’t a bull market killer. False signals abound, and our research shows inversions usually must be deep, lasting and global to truncate an economic expansion. In our view, stocks are good at seeing through such noise.
Again, none of this precludes potential rate hikes hitting sentiment for a while. Maybe interest rate jitters spook markets into a pullback or even a correction (a sharp, sentiment-fuelled drop of -10% to -20%). Or maybe they don’t—we think there is no way to know. Our research shows short-term swings ride on sentiment, which we think is inherently unpredictable. But if things look rocky for a bit, we suggest long-term growth-seeking investors stay cool, remember that history suggests it is fine to fight the Fed, and remember false fears often look right for a spell when negativity strikes. But we think markets climb a wall of worry constructed chiefly from plausible-seeming false fears, and we suspect that will follow the current dust-up, too.
[i] Source: FactSet, as of 5/1/2022. Statement based on MSCI World Index and constituent country market capitalisations. Market capitalisation is a measure of the total market value of a company or stock index, calculated as share price multiplied by number of shares outstanding.
[ii] “Minutes of the Federal Open Market Committee,” 14 – 15 December 2021.
[iii] Source: FactSet, as of 5/1/2022. S&P 500 price return in USD on 5/1/2022. Currency fluctuations between the dollar and pound may result in higher or lower investment returns.
[iv] Ibid. Statement based on the correlation coefficient between the S&P 500 and MSCI World Ex. USA Indexes. The correlation coefficient is a statistical measure of the directional relationship between two variables. A correlation of 1.0 implies they move in lockstep, 0 implies no relationship, and -1.0 implies they move in polar opposite directions.
[v] Ibid. Statement based on S&P 500 price index level in USD. Currency fluctuations between the dollar and pound may result in higher or lower investment returns.
[vi] Ibid. Statement based on S&P 500 price index level in USD. Currency fluctuations between the dollar and pound may result in higher or lower investment returns.
[vii] Ibid. Statement based on US federal funds target rate, the German Bundesbank’s policy rate and S&P 500 price index level in USD. Currency fluctuations between the dollar and pound may result in higher or lower investment returns.
[viii] Ibid. Statement based on US federal funds target rate and 10-year US Treasury yields.
[ix] Ibid. Statement based on US Consumer Price Index, a measure of goods and services prices across the broad economy.
[x] Ibid.
Get a weekly roundup of our market insights.
Sign up for our weekly e-mail newsletter.

You Imagine Your Future. We Help You Get There.
Are you ready to start your journey to a better financial future?

Markets Are Always Changing—What Can You Do About It?
Get tips for enhancing your strategy, advice for buying and selling and see where we think the market is headed next.
Related Resources
-
Market Analysis Today in Brexit, Day 3,652: Brexit Turns 102026-06-24
-
Market Analysis Reviewing America’s Q1 Earnings and What Q2 Expectations Say2026-06-23
-
Politics Revolving Door Turns, Uncertainty Starts Falling2026-06-23
-
Macro Insights SpaceX IPO and Rising Equity Supply2026-06-23


Contact Us
Learn why 200,000 clients trust Fisher Investments and its affiliates to manage their money and find out how we may be able to help you achieve your financial goals.
As of 31/03/2026. Includes Fisher Investments and its affiliates.
New to Fisher? Call Us.
Contact Us Today