Personal Wealth Management / Market Analysis
Why We Don’t Think Valuations Should Worry You
Near term or long term, our research shows valuations don’t predict stock returns.
With stocks enduring a sharp decline to start 2022, negative analyses abound as fearful headlines in publications we follow tout reasons things will only get worse.[i] One subject we have found cropping up amongst them: valuations—measures attempting to gauge the value of a stock based on comparisons of its price to metrics like the company’s sales or profits. Many commentators we follow claim that, even after this year’s share price declines, stocks are still too high. Some take a near-term view, suggesting today’s valuations aren’t at trough levels for a new bull market to start.[ii] Others suggest current valuations point to historically low long-term returns ahead.[iii] But we think you can set such worries aside: Our study of history and data show valuations predict neither short-term nor long-term returns.
Valuations, especially price-to-earnings (P/E) ratios, are amongst the most watched market metrics out there, in our experience. Hence, many commentators we read have noticed the big drop in America’s S&P 500 12-month forward P/E, to use one example. (Though forward earnings are only estimates, some analysts we follow often prefer using them in P/Es’ denominator because investors typically own stocks for future, not past, profits.) From 23 at the year’s start, it has fallen to 16 now, a roughly 30% discount.[iv] Cheaper! However, 16 is about average historically.[v] Similarly, trailing 12-month P/Es, which compare current prices to the past 12 months’ earnings, are also around average.[vi] Even broader, global indexes like the MSCI World show something similar.[vii]
To hear many bargain-hunting commentators we follow say it, average isn’t cheap—or at least, it isn’t cheap enough for the market slide’s bottom to be near. It especially isn’t cheap enough for Tech and the Tech-heavy US market, which led world markets until recently, they say.[viii] But as we showed last September, our research indicates P/Es don’t predict turning points in markets—or returns over the next year. Using a statistical measure called R2, which tells you how much P/Es can explain the next 12 months’ returns—ranging from 0 (not at all) to 1 (fully)—America’s S&P 500 has an R2 of 0.01.[ix] That means that, historically, whatever valuation US stocks are at—high, low or average—we think it is a coin flip what direction stocks will go from there. In our experience, expensive stocks can always become more expensive, and cheap stocks can always get cheaper.
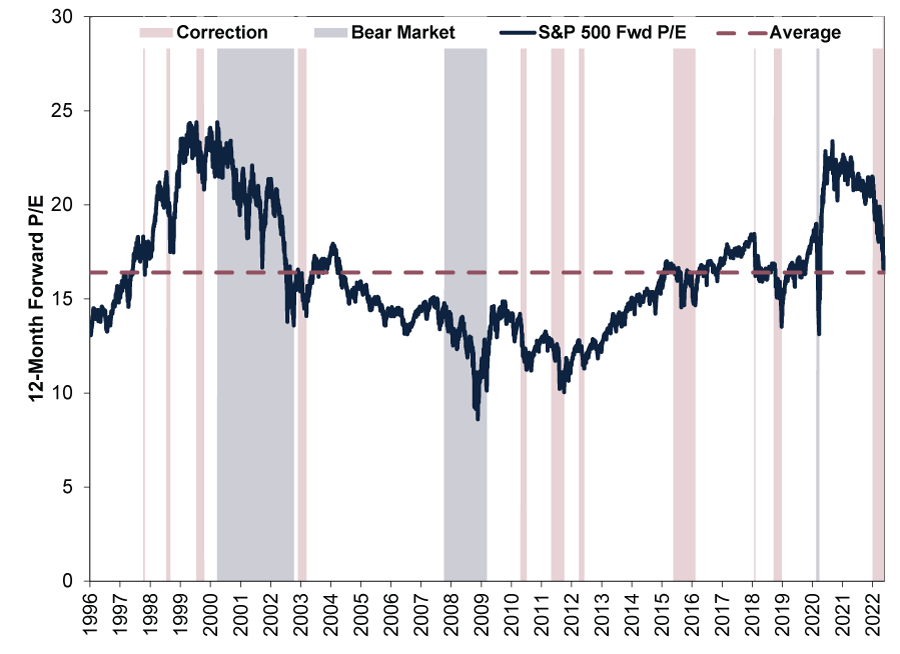
To see this another way, Exhibit 1 shows how forward P/Es bob and weave during corrections (sharp sentiment-fuelled -10% to -20% pullbacks, pink shading) and bear markets (fundamentally driven declines exceeding -20%, blue shading). Yes, naturally, this shows that P/Es tend to overall drop through both, but there is no set point when corrections and bear markets begin or end, based on our observations.
Exhibit 1: Corrections End at High, Middle and Low P/Es
Source: FactSet, as of 25/5/2022. S&P 500 12-month forward P/E, 1/1/1996 – 24/5/2022. Bear market and correction dating is based on S&P 500 price returns presented in USD. Currency fluctuations between the dollar and pound may result in higher or lower investment returns and different dates.
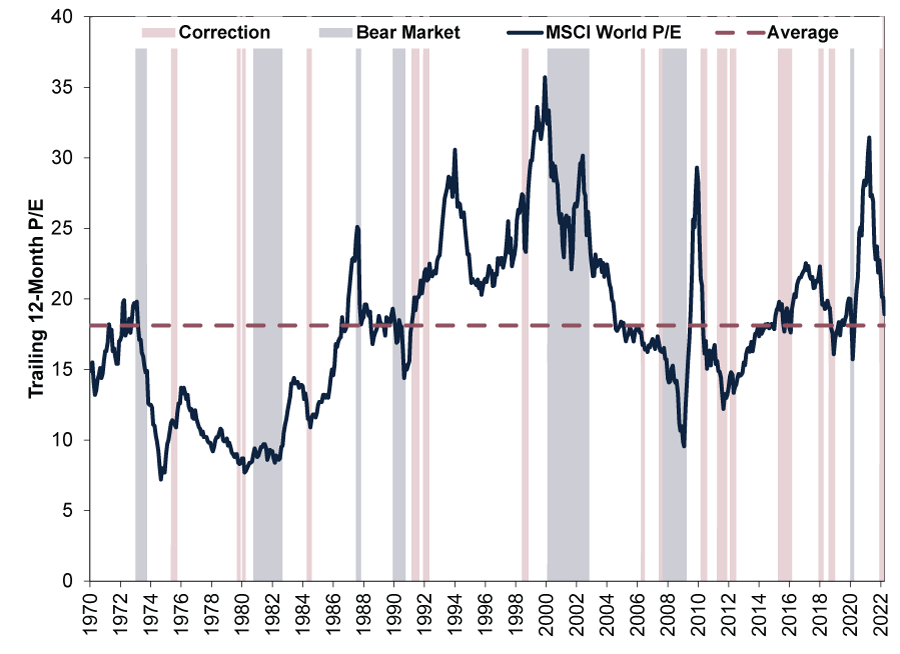
Even trailing P/Es’ longer history doesn’t support the view they predict, according to our analysis. Exhibit 2 shows MSCI World bear markets ending at above-average P/Es, as economic downturns obliterated earnings—and forward-looking stocks took off expecting better days to come. 2000 – 2002’s bear market is a good example of that, in our view.
Exhibit 2: No Rhyme or Reason to P/Es and Market Regimes
Source: FactSet, as of 25/5/2022. MSCI World trailing 12-month P/E, January 1970 – April 2022. Bear market and correction dating is based on MSCI World price returns presented in USD. Currency fluctuations between the dollar and pound may result in higher or lower investment returns and different dates.
Some commentators we follow admit that P/Es can’t identify turning points. Instead, they say P/Es imply a long period of low returns ahead—maybe even a lost decade.[x] But our research shows there isn’t any strong correlation between valuations and long-term returns, either. As best as we can find, the S&P 500’s trailing 12-month P/Es have only a slight correlation with its subsequent 20-year returns.[xi] At that timeframe, the R2 is 0.27—weak and statistically pretty insignificant, in our view.[xii] This all makes sense to us. We think predicting far-future corporate profit margins and earnings growth is just guessing. Not only are long-term earnings forecasts irrelevant, figuring out what investors will likely pay for those guesses is nigh impossible—it is a futile endeavour, in our view.
We think valuations don’t tell investors anything useful about future returns for multiple reasons. One, trailing earnings are backward-looking. Two, both trailing and forward-looking earnings, as well as other ways to slice and dice companies’ metrics—and projected metrics—are amongst the most pored-over figures on Wall Street, in our experience. As all the current attention attests from headlines we read, they appear widely watched. But as we think Finance 101 also suggests, factors everyone pays attention to have limited predictive ability. To be useful, in our view, forecasts have to incorporate information others miss—or look at available data differently from the crowd. Otherwise, we think adaptive markets likely reflect the information already. It is a high bar, which headline valuation fears don’t meet, in our view.
[i] Source: FactSet, as of 25/5/2022. Statement based on MSCI World returns with net dividends, in GBP, 31/12/2021 – 24/5/2022.
[ii] “Tech Stocks Are in a Bear Market, But They Aren’t Cheap,” Nir Kaissar, Bloomberg, 16/5/2022. Accessed via Yahoo! A bull market is a period of prolonged overall rising stock prices.
[iii] “This Could Be a Lost Decade for Stocks,” Spencer Jakab, The Wall Street Journal, 18/5/2022. Accessed via the Internet Archive.
[iv] Source: FactSet, as of 25/5/2022. S&P 500 next-12-month P/E ratio, 31/12/2021 – 24/5/2022.
[v] Ibid. Average S&P 500 next-12-month P/E ratio, September 1995 – April 2022.
[vi] Ibid. Statement based on average S&P 500 last-12-month P/E ratio, August 1990 – April 2022.
[vii] Ibid. Statement based on average MSCI World Index last-12-month P/E ratio, January 1970 – April 2022.
[viii] Source: FactSet, as of 25/5/2022. Statement based on MSCI World Information Technology sector returns with net dividends relative to the overall MSCI World’s return with net dividends, 16/3/2020 – 31/12/2021.
[ix] Source: Global Financial Data, Inc., as of 25/5/2021. S&P 500 trailing 12-month P/E, monthly, and subsequent rolling 12-month price returns, December 1925 – April 2021. Presented in US dollars. Currency fluctuations between the dollar and pound may result in higher or lower investment returns.
[x] “This Could Be a Lost Decade for Stocks,” Spencer Jakab, The Wall Street Journal, 18/5/2022. Accessed via the Internet Archive.
[xi] Source: Global Financial Data, Inc., as of 25/5/2021. S&P 500 trailing 12-month P/E, monthly, and subsequent rolling 20-year annualised price returns, December 1925 – April 2002. Presented in US dollars. Currency fluctuations between the dollar and pound may result in higher or lower investment returns.
[xii] Ibid. Presented in US dollars. Currency fluctuations between the dollar and pound may result in higher or lower investment returns.
Get a weekly roundup of our market insights.
Sign up for our weekly e-mail newsletter.

You Imagine Your Future. We Help You Get There.
Are you ready to start your journey to a better financial future?

Markets Are Always Changing—What Can You Do About It?
Get tips for enhancing your strategy, advice for buying and selling and see where we think the market is headed next.
Related Resources
-
In The News Predictions of an AI dystopia are the height of arrogance2026-03-23
-
Politics Beyond the War: A Political Roundup Covering America, Canada and Denmark2026-03-18
-
Economics Doubts Aplenty After UK January GDP Flatlined2026-03-18
-
Environmental, Social and Governance Insights Responsible Investment Newsletter 20262026-03-11


Contact Us
Learn why 195,000 clients trust Fisher Investments and its affiliates to manage their money and find out how we may be able to help you achieve your financial goals.
As of 31/12/2025. Includes Fisher Investments and its affiliates.
New to Fisher? Call Us.
Contact Us Today