Personal Wealth Management / Market Analysis
What to Make of a Popular Forward-Looking Indicator Today
The Conference Board’s US LEI has been falling for a while—what does it mean for investors?
Global think tank The Conference Board’s US Leading Economic Index (LEI) fell -0.3% m/m in February—its 11th straight monthly decline.[i] The gauge has a solid reputation as a forward-looking economic indicator amongst observers we follow, spurring warnings that its extended slide is proof a US recession (a decline in broad economic output) may be underway—or is coming soon. Considering America is the world’s largest economy and comprises close to 70% of global developed markets, its economic developments have global implications, in our view.[ii] Whilst a US recession is possible, it is by no means a foregone conclusion, as we will explain—nor is it assuredly predictive for stocks.
The US LEI has been around for over 70 years, and today’s version has 10 underlying components.[iii] With a handful of exceptions—e.g., a couple of labour measures, which our research shows are late-lagging economic indicators—most of the constituents are forward-looking, in our view. They include three sets of factory orders, the spread between the US Federal Reserve’s policy rate and 10-year Treasury yields (aka the interest rate spread), and the Leading Credit Index (LCI, a Conference Board-created gauge of loan availability and demand).[iv] Of LEI’s 10 components, 8 were negative or flat in February, extending recent trends.[v] The interest rate spread has now detracted for three straight months, whilst the LCI has weighed for seven.[vi] Accordingly, US LEI’s weakness has provided evidence for those arguing a US recession looms.
But we see some caveats worth considering. For example, LEI features goods production over services, even though the latter represent over 70% of US GDP.[vii] (Contrast that with the components that relate directly to factory orders, which comprise less than 20%.)[viii] In our view, LEI’s weakness isn’t consistent with services spending’s persistent growth over the past year. (Exhibit 1)
Exhibit 1: LEI Better Predicts Goods Than Services
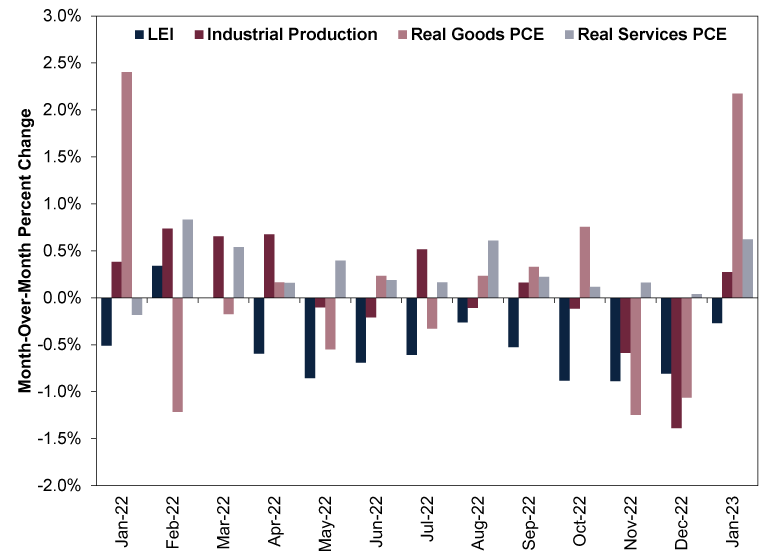
Source: FactSet and US Bureau of Economic Analysis, as of 17/3/2023. Real Goods PCE (personal consumption expenditures) and Real Services PCE are inflation-adjusted, broad measures of consumer spending.
We also think the interest rate spread—a proxy for banks’ future profit margins—may not be as telling of future conditions as it has been historically. Financial institutions borrow at short-term interest rates to finance long-term loans, with the spread (or difference) between the two representing lending’s profitability. Based on our research, banks have a higher incentive to take the risk of lending money if the potential payoff is worthwhile. A wider interest rate spread therefore implies more lending, which means more money available to households and businesses—fuel for economic growth. But the US fed-funds rate, which is the short end of LEI’s rate spread, is detached from lending today, according to our research. This rate determines the cost of interbank lending. Yet, overall, banks’ deposit bases are historically huge and cost nearly nothing, which we think makes them less reliant on the fed-funds market, as they can get funding much cheaper elsewhere.[ix] So with long-term rates up, lending is profitable and growing at double-digit year-over-year rates despite Fed rate hikes, limiting the interest rate spread’s historic predictive power, in our view.[x]
We aren’t dismissing LEI, as it is entirely possible its weakness over the past 12 months proves prescient and a mild US recession materialises.[xi] But if that happens, we don’t think it would surprise. In our view, last year’s bear market (a typically prolonged, fundamentally driven downturn of -20% or more) in the S&P 500 suggests US stocks pre-priced domestic economic weakness to a great degree—we saw similar behaviour in German markets.[xii]
Another wildcard, in our view: how the recent US regional bank scare affects lending. Even though our analysis of US banks’ balance sheets suggests they are in excellent shape, it is possible financial institutions become ultra conservative and hold more in reserves rather than lend as they wait and see what the US Federal Reserve (Fed) does—and whether the societal panic we have seen surrounding the saga calms. Perhaps the events surrounding Credit Suisse’s near-failure and subsequent purchase by UBS add to banks’ simmering risk aversion. We will monitor weekly loan growth data closely for clues, as the episode could have a broader economic impact, especially if the Fed reinstates reserve requirements in response. That said, LEI’s components don’t yet register these factors, either, so we don’t think its decline to date indicates whether banking problems are set to ripple now. As telling as LEI is, we think the measure has its limits, which are worth keeping in mind as recession projections top headlines.
[i] Source: FactSet, as of 17/3/2023.
[ii] Source: World Bank and FactSet, as of 20/3/2023. Statement based on 2021 US gross domestic product (GDP, a government-produced measure of economic output) in constant 2015 USD and America’s market capitalisation as a percentage of the MSCI World Index. Market capitalisation (share price times number of shares outstanding) is a measure of market value.
[iii] See note i.
[iv] Ibid.
[v] Ibid.
[vi] Ibid.
[vii] Ibid.
[viii] Ibid.
[ix] Source: FactSet and St. Louis Federal Reserve, as of 20/3/2023. Statement based on total deposits at US commercial banks, as of February 2023, and average national deposit rate: savings, as of 20/3/2023.
[x] Ibid. Statement based on 10-year US Treasury Yield, as of 17/3/2023, and year-over-year change in weekly loans and leases in bank credit for all commercial banks, as of 8/3/2023.
[xi] See note i.
[xii] See note i. Statement based on S&P 500 Total Return Index, in USD, 3/1/2022 – 14/10/2022. Currency fluctuations between the dollar and pound may result in higher or lower investment returns.
Get a weekly roundup of our market insights.
Sign up for our weekly e-mail newsletter.

You Imagine Your Future. We Help You Get There.
Are you ready to start your journey to a better financial future?

Markets Are Always Changing—What Can You Do About It?
Get tips for enhancing your strategy, advice for buying and selling and see where we think the market is headed next.
Related Resources
-
Market Analysis Today in Brexit, Day 3,652: Brexit Turns 102026-06-24
-
Market Analysis Reviewing America’s Q1 Earnings and What Q2 Expectations Say2026-06-23
-
Politics Revolving Door Turns, Uncertainty Starts Falling2026-06-23
-
Macro Insights SpaceX IPO and Rising Equity Supply2026-06-23


Contact Us
Learn why 200,000 clients trust Fisher Investments and its affiliates to manage their money and find out how we may be able to help you achieve your financial goals.
As of 31/03/2026. Includes Fisher Investments and its affiliates.
New to Fisher? Call Us.
Contact Us Today