Personal Wealth Management / Economics
The US Economy Is Off to a Fine Start
Manufacturing recovers whilst consumer spending chugs along.
For months, headlines we read have highlighted the apparent disconnect between America’s resilient economy and sceptical sentiment towards it. Even as we observed recession (deep and/or prolonged economic contraction) warnings fade and gross domestic product (GDP) accelerate in last year’s second half, there remains the perception from commentators we follow that the expansion is on shaky ground.[i] Yet we find a wealth of data showing otherwise. In our view, the latest on consumer spending and manufacturing provide further evidence economic activity is better than the financial press we cover extensively tends to portray and show why brightening sentiment likely continues.
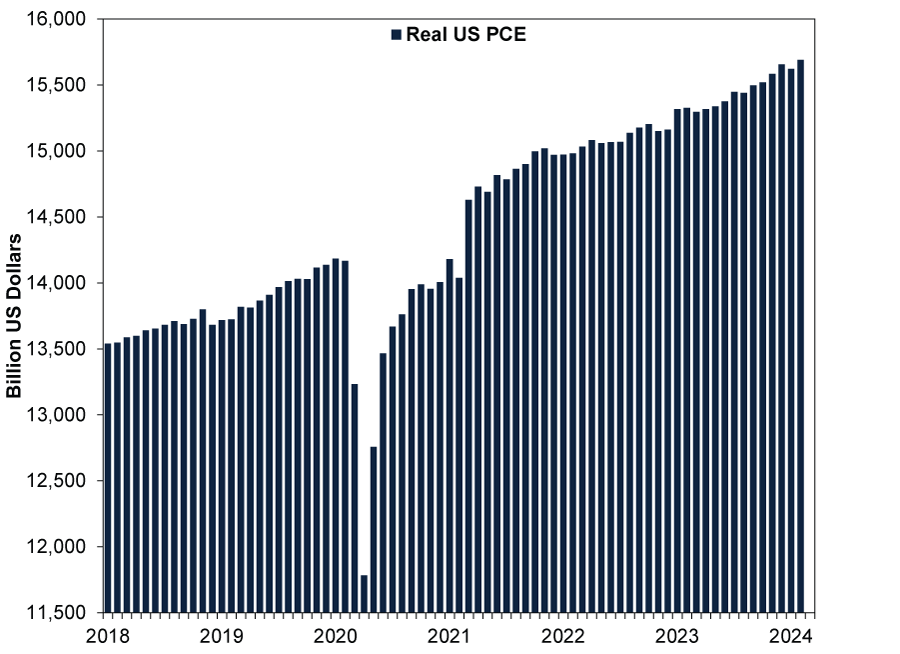
Good Friday’s release of America’s February personal consumption expenditures (PCE) showed solid growth in US consumer spending adjusted for inflation, which constitutes 69% of its GDP.[ii] As Exhibit 1 shows, after January’s -0.2% m/m dip in real (inflation-adjusted) PCE, February’s 0.4% rebound hit a new high, continuing its march upward in line with its long-term trend that picked up where it left off post-pandemic.
Exhibit 1: Inflation-Adjusted US Consumer Spending Is Trending Higher
Source: FactSet, as of 10/4/2024.
Under the bonnet, services’ 0.6% m/m rise did the heavy lifting, accelerating from January’s 0.3% and the fastest rate since July 2021, whilst goods spending inched only 0.1% higher after leading January’s decline.[iii] Although growth in services consumption—two-thirds of PCE—has been relatively steady given its mostly non-discretionary makeup (think rent, utilities, healthcare and insurance), goods growth has been rockier.[iv] Particularly for durable goods (those goods designed to last three years or longer, which comprise 38% of total goods spending and 13% of PCE), since they tend toward discretionary items like recreational equipment and home electronics versus non-durable goods, essentially food, clothing, petrol and medicine.[v]
But is the rockier road lately a sign of troubled demand, or is there something else afoot? Durable goods have experienced bigger than usual swings near yearend and into the new year since the pandemic.[vi] December to February’s sequence was 1.6% m/m, -2.7% and 1.2%, respectively.[vii] The year prior’s inverted the signs with a huge 5.0% m/m gain in January and small dips before and after.[viii] To us, this suggests seasonal adjustment calculations that ordinarily smooth out regular calendar-year spending habits still incorporate some skew from lockdowns and re-openings, heightening monthly volatility surrounding the holiday period instead of dampening it (seasonal adjustments tend to be based on the prior few years’ results). We think this, on top of the US Census Bureau’s well-documented struggles with early-year seasonal adjustments, is something for investors to be aware of and emphasises why it pays to dig below the headline numbers to see what is actually going on and where the trends point.
On that note, whilst US goods consumption—again, on an inflation-adjusted basis—has crept slowly higher over the last year, it remains slightly below 2021’s peak, when lockdown spending on things surged at services’ expense.[ix] But being roughly on par with 2021’s peak goods buying is no small feat, in our view, because it shows demand for tangible items has recovered on its own to pandemic-boosted consumption levels three years ago.
Bigger picture, we think America’s ongoing PCE growth overall shows US households—the backbone of their economy—are on solid footing despite the constant drumbeat of warnings about consumer debt and weak savings we see in headlines. We find PCE isn’t an economic swing factor—that honour goes to business investment, based on America’s long economic data history—but it still shows reality beating perceptions across a big swath of the US economy.
Whilst US consumer spending enjoyed a steady ascent over the last couple of years, manufacturing had tougher sledding.[x] But we see this tide turning, with the American Institute for Supply Management’s (ISM) Manufacturing Purchasing Managers’ Index (PMI) topping 50 for the first time since October 2022, the latest indication of green shoots this spring. PMIs are business surveys measuring the percentage of businesses that report growth in the month, with readings over 50 indicating expansion. The March ISM Manufacturing PMI release showed it rising 2.5 points to 50.3, as the navy line in Exhibit 2 depicts.
Exhibit 2: US Manufacturing PMI Turns Up, but Output Trends Flat
Source: FactSet, as of 10/4/2024. US ISM Manufacturing PMI, January 2014 – March 2024, and US industrial production – manufacturing output, January 2014 – February 2024. Readings over 50 indicate expansion.
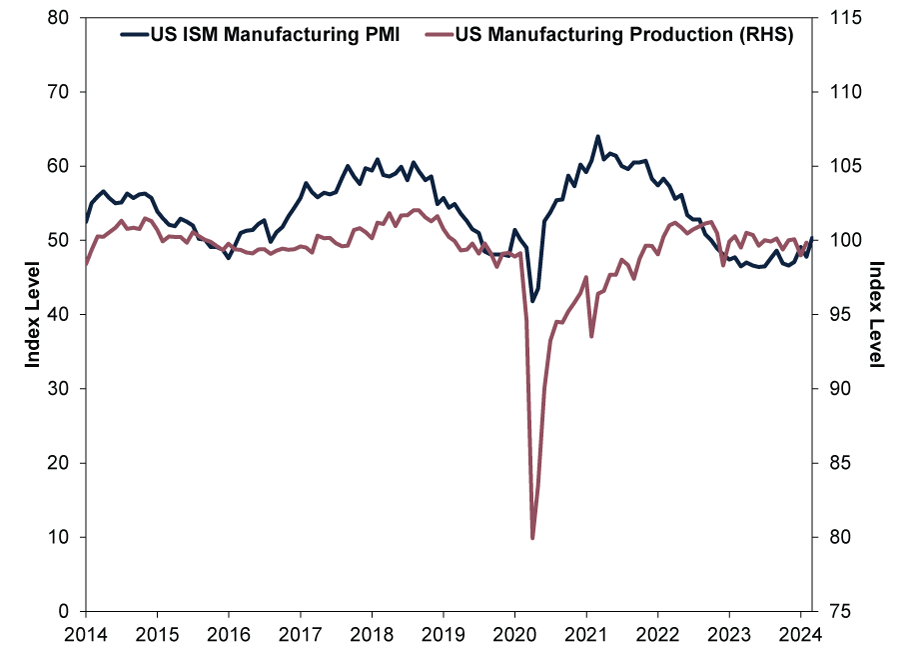
Peeking above 50 means the majority of businesses surveyed say their activity is expanding, which we find encouraging, though we don’t think this is exactly an earthshattering development, as S&P Global’s US manufacturing PMI gauge pointed that way earlier. We doubt this is a huge factor for total economic growth, though. Manufacturing’s US economic heft is small, 16% of its GDP versus services production’s 72% share.[xi] The 16-month downturn below 50 didn’t prevent America’s economic expansion—given services’ and PCE’s ongoing advances (see Exhibit 1 again on the latter).
We aren’t arguing a massive manufacturing boom is at hand. PMIs measure only growth’s breadth—not its magnitude—so they can’t say how strong or weak output really is. As Exhibit 2’s maroon line shows, US manufacturing output remains below its September 2018 peak, at least through February, the latest release. But we think there is mounting evidence the sector is moving on from its soft patch. Manufacturing output ticked up 0.1% m/m in February—and February durable goods and factory orders’ rises point positively for future production.[xii]
From a GDP standpoint, an American manufacturing recovery amounts to a small headwind flipping to a mild tailwind. But we think it casts some light on the stock market’s recent behaviour, as nascent signs of manufacturing growth hint at the economy’s broadening expansion. We find that is also consistent with widening market breadth—the percentage of stocks outperforming, with more than a third of S&P 500 stocks beating the index over the last 12 months versus less than a quarter in late 2023 and earlier this year.[xiii] And with more stocks participating in the bull market, particularly in value-orientated categories like Energy and Industrials, we think they are probably pricing in a cyclical upswing that pulls along more economically sensitive sectors.[xiv]
We think this also points to a potential leadership shift from growth to value as financial and economic conditions become more favourable for cyclical companies.[xv] In our view, it probably wouldn’t be an immediate thing, but rather a gradual, uneven transition that ebbs and flows. Some of this might be from rate cuts, though we think this factor is overrated and misperceived, since high rates haven’t hampered growth to begin with—because credit remains accessible. But rate cuts could help make credit more accessible than it already is and improve sentiment toward value-heavy categories.
Couple that with US business investment gradually shifting from retrenchment—after nearly two years of businesses cutting back in anticipation of a recession that never came—to a more offensive stance, and we see the opportunity for sentiment to warm further, reflecting the brightening outlook.[xvi] For example, investment in intellectual property products (i.e., software, R&D and digital media) has far outstripped capital expenditures for new plants and equipment this cycle.[xvii] But with capital goods orders (excluding aircraft and defence) picking up this year, that may begin to change.[xviii]
For investors, we think this points to continued economic growth, which more investors can start to appreciate. One way to see this: the Atlanta branch of the US Federal Reserve’s GDPNow, which compiles incoming data—like consumer spending and manufacturing PMIs—and uses that to estimate current quarter US GDP. Putting it all together, GDPNow is tracking at 2.5% annualised for America’s Q1 GDP, um, now.[xix] Now, that would be slower than Q4’s 3.4% annualised growth (and Q3’s 4.9%), but it is probably skewed by aforementioned seasonal adjustments hitting January’s data.[xx] We will watch how it changes. But in our view, even slower growth is still fine for stocks because the longer it continues, the more it can convert naysayers, fuelling the bull market.
Although we find sentiment has warmed lately, we don’t think it has caught up to reality yet—which we see in the misplaced focus on manufacturing and ongoing obsession with rate cuts. The proverbial wall of worry stocks climb still seems sizeable to us, leaving plenty of room for positive surprise despite the budding optimism we observe.
[i] Source: US Bureau of Economic Analysis (BEA), as of 10/4/2024. Statement based on US GDP, Q3 2023 – Q4 2024. GDP is a government measure of economic output.
[ii] Source: BEA, as of 10/4/2024. US PCE’s percentage of GDP, 2023.
[iii] Source: FactSet, as of 10/4/2024. US PCE goods and services, February 2024.
[iv] Source: BEA, as of 10/4/2024. US PCE services percentage of total, February 2024.
[v] Source: BEA, as of 10/4/2024. US PCE durable goods as a percentage of PCE goods and total, February 2024.
[vi] Source: BEA, as of 10/4/2024. Statement based on US PCE durable goods.
[vii] Source: BEA, as of 10/4/2024. US PCE durable goods, December 2023 – February 2024.
[viii] Source: BEA, as of 10/4/2024. US PCE durable goods, December 2022 – February 2023.
[ix] Source: FactSet, as of 10/4/2024. Statement based on US PCE goods and services.
[x] Source: FactSet, as of 10/4/2024. Statement based on US ISM Manufacturing PMI, January 2014 – March 2024, and US industrial production – manufacturing output, January 2014 – February 2024.
[xi] Source: BEA, as of 10/4/2024.
[xii] Source: FactSet, as of 10/4/2024. US industrial production – manufacturing output, February 2024. Statement based on US factory and durable goods orders, February 2024.
[xiii] Source: Clarifi, as of 2/4/2024. Statement based on trailing 12-month S&P 500 breadth (% outperforming).
[xiv] Source: FactSet, as of 10/4/2024. Statement based on S&P 500 Energy and Industrials sectors. Value-orientated companies are those that return more cash to shareholders and trade at relatively low prices compared to underlying business measures, like sales or earnings. A bull market is a long period of generally rising stock prices.
[xv] Growth-orientated companies are those that tend to reinvest profits into their core business and typically trade at higher prices compared to corporate earnings and other similar measures.
[xvi] Source: FactSet, as of 10/4/2024. Statement based on US private non-residential fixed investment.
[xvii] Source: Federal Reserve Bank of St. Louis, as of 10/4/2024. Statement based on non-residential investment in intellectual property products, equipment and structures.
[xviii] Source: Federal Reserve Bank of St. Louis, as of 10/4/2024. Statement based on non-defence capital goods orders excluding aircraft.
[xix] Source: Federal Reserve Bank of Atlanta, as of 10/4/2024. An annualised rate is the rate at which GDP would expand or contract over a full year if the reported quarter’s growth rate persisted for four quarters.
[xx] Source: FactSet, as of 10/4/2024.
Get a weekly roundup of our market insights.
Sign up for our weekly e-mail newsletter.

You Imagine Your Future. We Help You Get There.
Are you ready to start your journey to a better financial future?

Markets Are Always Changing—What Can You Do About It?
Get tips for enhancing your strategy, advice for buying and selling and see where we think the market is headed next.
Related Resources
-
Market Analysis Today in Brexit, Day 3,652: Brexit Turns 102026-06-24
-
Market Analysis Reviewing America’s Q1 Earnings and What Q2 Expectations Say2026-06-23
-
Politics Revolving Door Turns, Uncertainty Starts Falling2026-06-23
-
Macro Insights SpaceX IPO and Rising Equity Supply2026-06-23


Contact Us
Learn why 200,000 clients trust Fisher Investments and its affiliates to manage their money and find out how we may be able to help you achieve your financial goals.
As of 31/03/2026. Includes Fisher Investments and its affiliates.
New to Fisher? Call Us.
Contact Us Today